Examples
Create a scatter histogram.
x = randn(200, 1);
y = 0.5 * x + randn(200, 1);
scatterhistogram(x, y, 'NumBins', 20);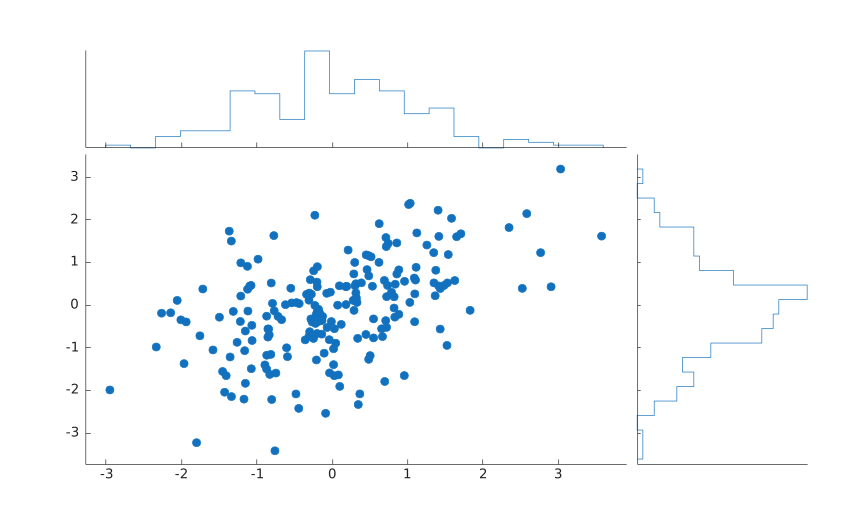
scatterhistogram(x, y)
scatterhistogram(..., 'NumBins', n)
scatterhistogram(..., 'MarkerStyle', marker)
h = scatterhistogram(...)
scatterhistogram creates a scatter plot and displays histograms for the x and y data distributions.
The returned object has type scatterhistogram. See scatterhistogram properties for the complete property list.
x = randn(200, 1);
y = 0.5 * x + randn(200, 1);
scatterhistogram(x, y, 'NumBins', 20);