binscatter
Display binned scatter plot.
📝Syntax
binscatter(x, y)
binscatter(x, y, n)
binscatter(..., 'XLimits', limits, 'YLimits', limits)
binscatter(..., Name, Value)
binscatter(parent, ...)
h = binscatter(...)
📄Description

binscatter counts points in two-dimensional bins and displays the counts as a native binscatter chart object.

Values, XBinEdges, and YBinEdges are computed read-only properties.

When the axes are zoomed, the chart recomputes smaller bins so the visible region keeps approximately the requested bin density.

See binscatter properties for the complete property list.

💡Examples
Display binned scatter density.
x = randn(1000, 1);
y = x + 0.5 * randn(1000, 1);
h = binscatter(x, y, [30 30]);
h.FaceAlpha = 0.9;
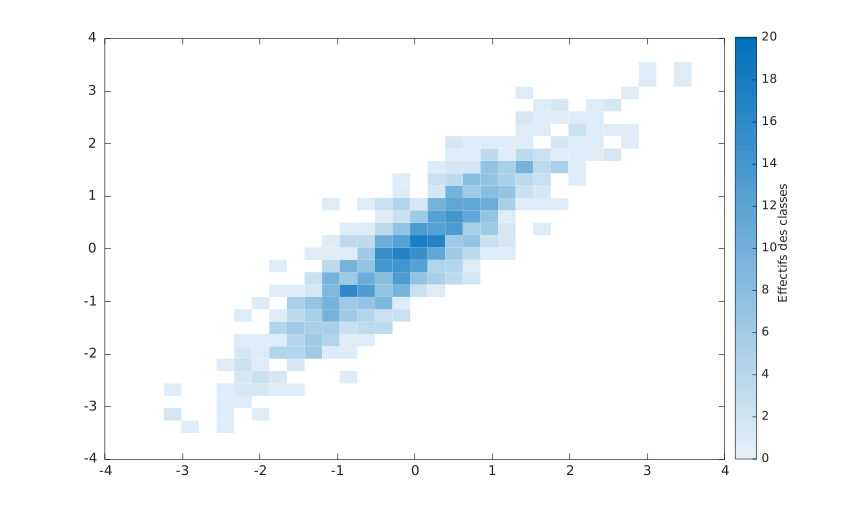
Example illustration
Inspect computed bin values and edges.
x = [0.1 0.2 0.8 1.2 1.8 1.9];
y = [0.1 0.9 0.8 1.2 1.1 1.9];
h = binscatter(x, y, [2 2], 'XLimits', [0 2], 'YLimits', [0 2]);
h.Values
h.XBinEdges
h.YBinEdges
🔗See Also
binscatter propertiesscatterhistogram2
Edit this page on GitHub