histogram(X)
histogram(X, nbins)
histogram(X, edges)
histogram(C)
histogram(C, categories)
histogram(..., propertyName, propertyValue)
histogram(ax, ...)
h = histogram(...)
| Parameter | Description |
|---|---|
| X | numeric input data. |
| nbins | number of bins. |
| edges | strictly increasing bin edges. |
| C | categorical input data. |
| categories | cell array of character vectors or string array selecting the categories to display and their order. |
| propertyName | histogram object property name. |
| propertyValue | histogram object property value. |
| ax | target axes object. |
| Parameter | Description |
|---|---|
| h | histogram graphics object. |
histogram bins numeric data and displays the bin values as bars or stairs.
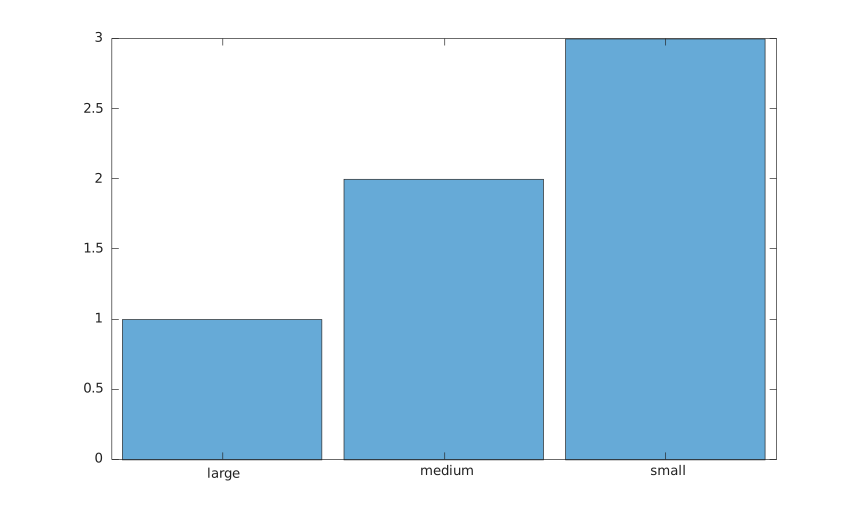
When C is a categorical array, histogram draws one bar per category, with a bar height equal to the number of elements in that category. The bars are displayed in category order (as returned by categories), and the category names are used as tick labels. A second argument may list the categories to display and their order.
See histogram properties for the complete property list.
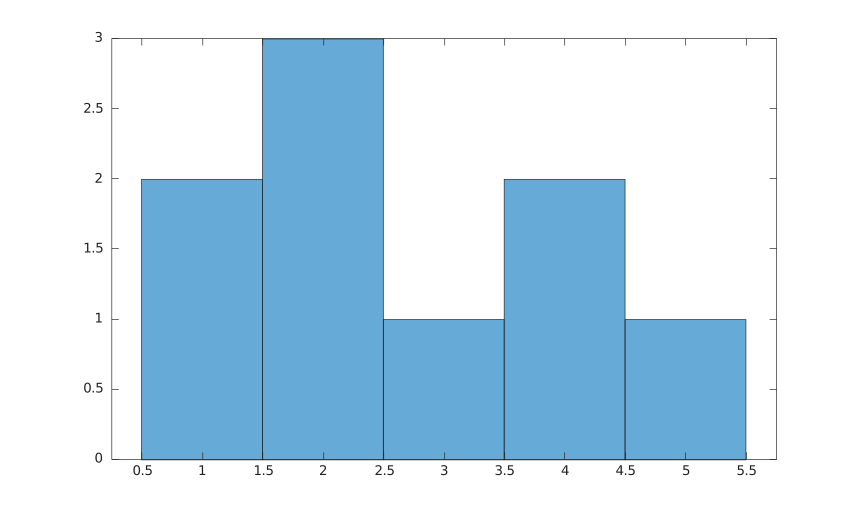
x = [1 1 2 2 2 3 4 4 5];
histogram(x);
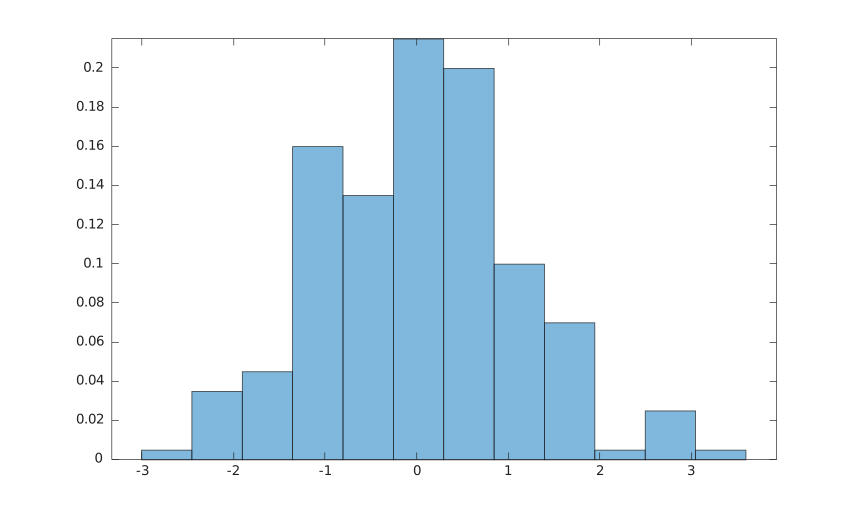
x = randn(200, 1);
histogram(x, 12, 'Normalization', 'probability', 'FaceAlpha', 0.5);
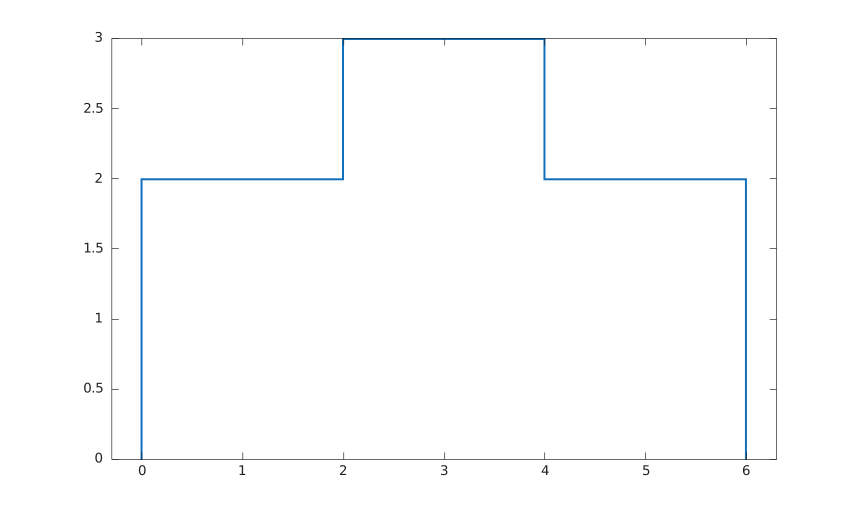
x = [1 1 2 3 3 4 5];
h = histogram(x, [0 2 4 6], 'DisplayStyle', 'stairs');
h.LineWidth = 1.5;
C = categorical({'small', 'medium', 'large', 'small', 'medium', 'small'});
histogram(C);