level = graythresh(I)
[level, effectiveness] = graythresh(I)
| Parameter | Description |
|---|---|
| I | Input image used to compute the histogram threshold. |
| Parameter | Description |
|---|---|
| level | Normalized threshold in the range [0, 1]. |
| effectiveness | Separability effectiveness metric in the range [0, 1]. |
Compute a global threshold using Otsu method. The optional second output is an effectiveness metric in the range [0, 1].
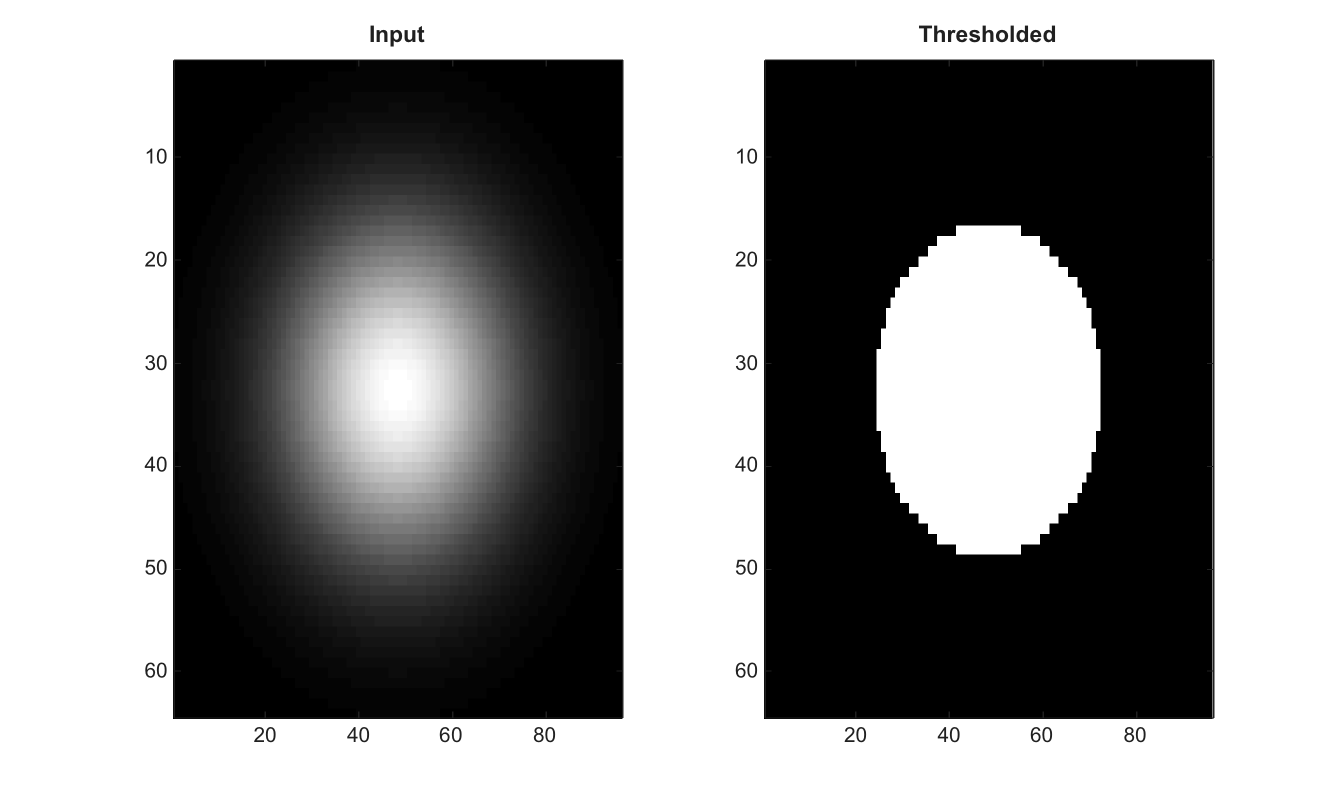
[X,Y]=meshgrid(linspace(-1,1,96),linspace(-1,1,64));
I=exp(-4*(X.^2+Y.^2));
[level,effectiveness]=graythresh(I);
BW=I>level;
figure; subplot(1,2,1); imagesc(I); g=linspace(0,1,64)'; colormap([g g g]); title('Input');
subplot(1,2,2); imagesc(BW); g=linspace(0,1,64)'; colormap([g g g]); title('Thresholded');
| Version | Description |
|---|---|
| 2.0.0 | initial version |