adaptthresh
Compute an adaptive image threshold.
📝Syntax
T = adaptthresh(I)
T = adaptthresh(I, sensitivity)
T = adaptthresh(__, 'ForegroundPolarity', polarity)
T = adaptthresh(__, 'NeighborhoodSize', size)
T = adaptthresh(__, 'Statistic', statistic)
📥Input Arguments
Parameter Description
I Input image.
sensitivity Scalar sensitivity value. The default is 0.5.
'ForegroundPolarity' Foreground polarity, either 'bright' or 'dark'.
'NeighborhoodSize' Two-element neighborhood size used for local statistics.
'Statistic' Local statistic: 'mean', 'gaussian', or 'median'.
📤Output Arguments
Parameter Description
T Adaptive threshold image with values in the range [0, 1].
📄Description

Compute a local threshold image for adaptive binarization. Supported foreground polarities are bright and dark. Supported statistics are mean, gaussian, and median.

💡Examples
Binarize an image with a local threshold
[X,Y]=meshgrid(linspace(-1,1,96),linspace(-1,1,64));
I=0.25+0.35*X+0.45*exp(-12*(X.^2+Y.^2));
T=adaptthresh(I,0.45,'NeighborhoodSize',[15 15]);
BW=I>T;
figure; subplot(1,3,1); imagesc(I); title('Input');
subplot(1,3,2); imagesc(T); title('Threshold');
subplot(1,3,3); imagesc(BW); title('Binary');
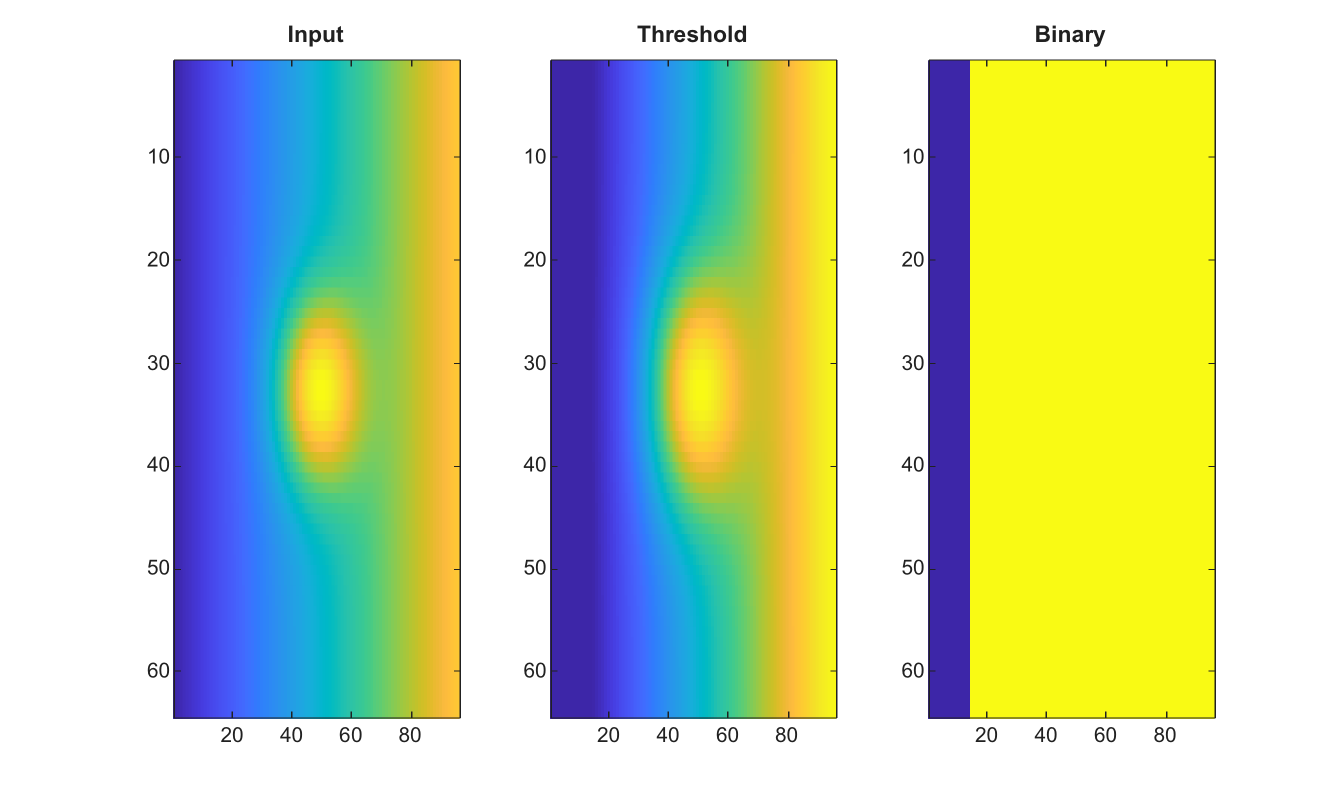
Example illustration
🔗See Also
imbinarizegraythresh
🕔Version History
Version Description
2.0.0 initial version
Edit this page on GitHub