yticklabels
Set or query y-axis tick labels.
📝Syntax
yticklabels(labels)
yticklabels('auto')
yticklabels('manual')
mode = yticklabels('mode')
labels = yticklabels
yticklabels(ax, ...)
labels = yticklabels(ax)
📥Input Arguments
Parameter Description
labels string array, cell array of character vectors, or character vector used as y-axis tick labels.
ax target axes object. If omitted, the current axes is used.
📤Output Arguments
Parameter Description
labels current y-axis tick labels.
mode current y-axis tick label mode: 'auto' or 'manual'.
📄Description

yticklabels sets or queries the YTickLabel property of an axes.

Assigning labels switches YTickLabelMode to manual. Use yticklabels('auto') to return to automatic labels.

💡Examples
Set y-axis tick labels for a horizontal bar graph.
f = figure();
barh([10 20 30 41]);
yticklabels({'April', 'May', 'June', 'July'});
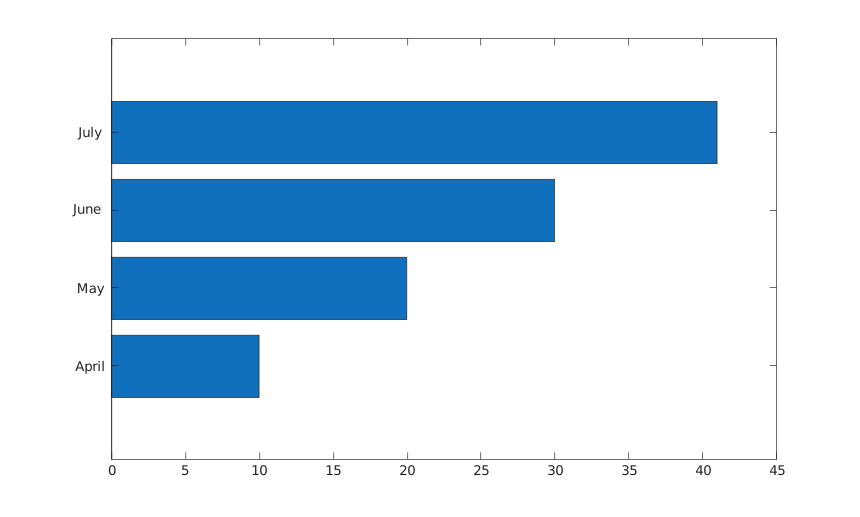
Example illustration
Set labels on specified axes and query the mode.
f = figure();
ax = axes('Parent', f);
plot(ax, 1:4, [2 4 3 5]);
ax.YTick = 2:5;
yticklabels(ax, ["low"; "mid"; "high"; "top"]);
mode = yticklabels(ax, 'mode')
🔗See Also
axesbarh
Edit this page on GitHub