barh
Horizontal bar graph.
📝Syntax
barh(Y)
barh(X, Y)
barh(..., width)
barh(..., color)
barh(..., 'grouped')
barh(..., 'stacked')
barh(tbl, yvar)
barh(tbl, xvar, yvar)
barh(..., propertyName, propertyValue)
barh(ax, ...)
b = barh(...)
📥Input Arguments
Parameter Description
X bar positions: scalar, vector, categorical array, string array, or cell array of labels.
Y bar values: vector or matrix.
width bar width, scalar, 0.8 by default.
color color name or short color name.
tbl table or timetable containing the plotted variables.
xvar table variable used for bar positions or labels.
yvar one or more numeric table variables used for bar values.
propertyName bar object property name.
propertyValue bar object property value.
ax target axes object.
📤Output Arguments
Parameter Description
b bar graphics object or vector of bar graphics objects.
📄Description

barh creates a horizontal bar graph. Matrix input creates grouped bars by default. Use 'stacked' to stack columns in each group.

For table input, select one variable for labels or positions and one or more numeric variables for values.

💡Examples
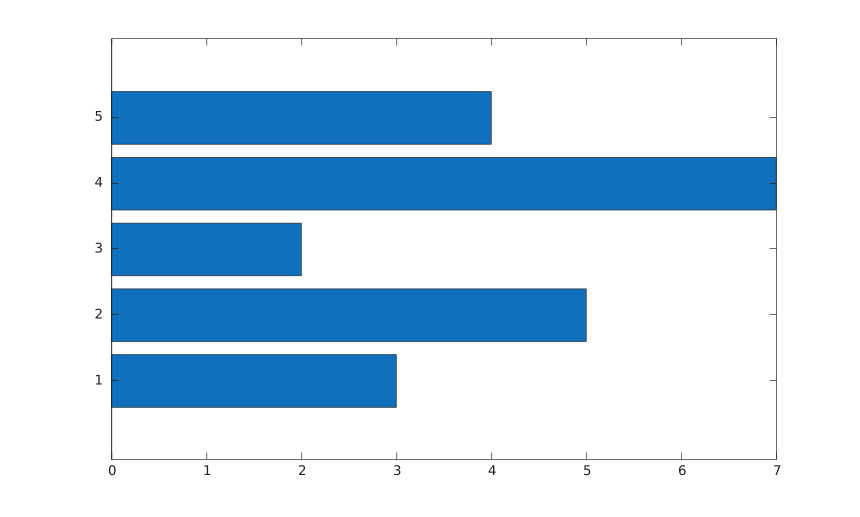
Horizontal bar graph from a vector.
f = figure();
y = [3 5 2 7 4];
barh(y);
Example illustration
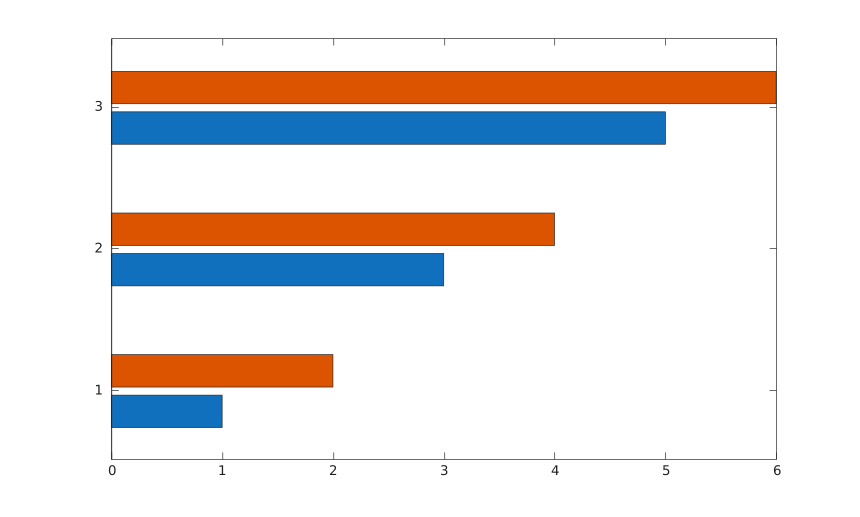
Grouped horizontal bars.
f = figure();
y = [1 2; 3 4; 5 6];
barh(y, 'grouped');
Example illustration
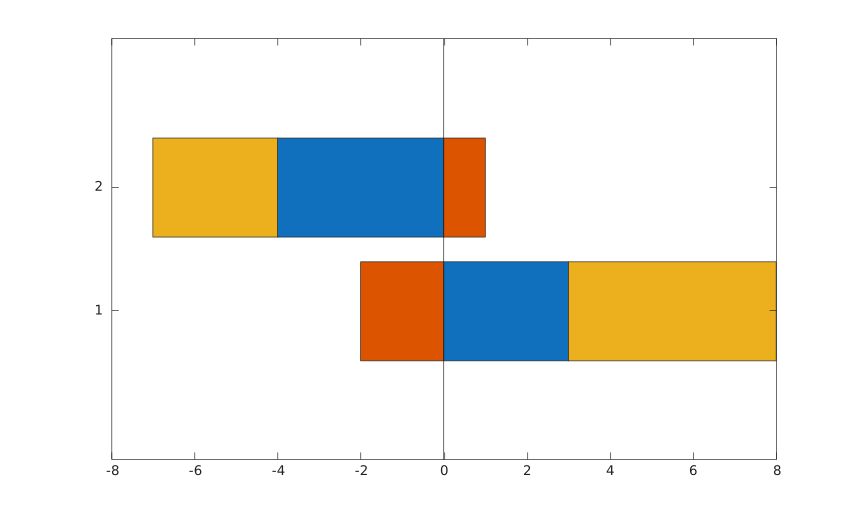
Stacked horizontal bars with positive and negative values.
f = figure();
y = [3 -2 5; -4 1 -3];
barh(y, 'stacked');
Example illustration
🔗See Also
barbar3h
Edit this page on GitHub