Examples
f = figure();
ax1 = axes('Position', [0.1 0.1 0.7 0.7]);
ax2 = axes('Position', [0.65 0.65 0.28 0.28]);
x = linspace(0,10);
y1 = sin(x);
y2 = cos(x);
plot(ax1, x, y1);
plot(ax2, x, y2);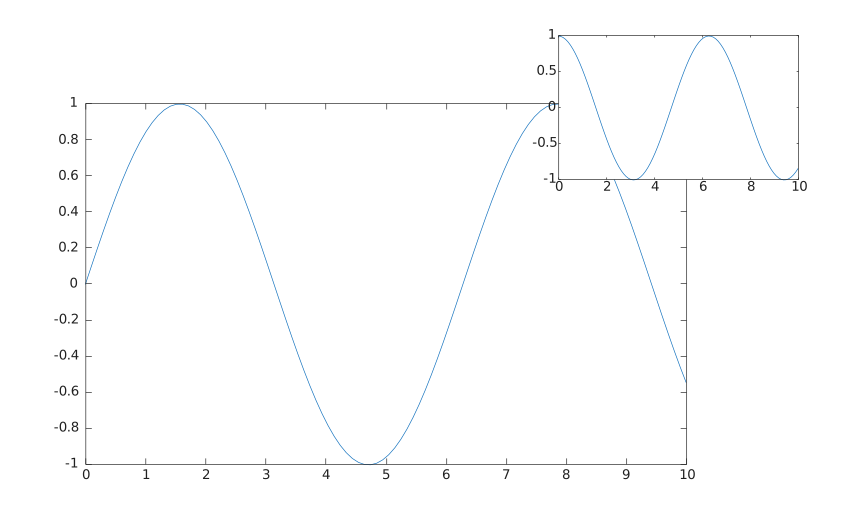
ax = axes()
ax = axes(parent)
ax = axes(propertyName, propertyValue)
ax = axes(parent, propertyName, propertyValue)
axes(cax)
| Parameter | Description |
|---|---|
| parent | a scalar graphics object value: parent container, specified as a figure. |
| cax | axes to make current. |
| propertyName | a scalar string or row vector character. |
| propertyValue | a value. |
| Parameter | Description |
|---|---|
| ax | a graphics object: axes type. |
axes creates axes in the current figure and set it as the current axes.
axes(cax) set current axes.
Clicking on an axis automatically sets it as the current axes object.
See axes properties for the complete property list.
f = figure();
ax1 = axes('Position', [0.1 0.1 0.7 0.7]);
ax2 = axes('Position', [0.65 0.65 0.28 0.28]);
x = linspace(0,10);
y1 = sin(x);
y2 = cos(x);
plot(ax1, x, y1);
plot(ax2, x, y2);| Version | Description |
|---|---|
| 1.0.0 | initial version |
| 1.2.0 | Clicking on an axis automatically sets it as the current axes object. |
| -- | GridAlpha, GridColor propertiew for Axes. |
| 1.7.0 | CreateFcn, DeleteFcn callback added. |
| -- | BeingDeleted property added. |
| -- | Axes property documentation updated. |