fimplicit(fun)
fimplicit({fun1, fun2, ...})
fimplicit(fun, interval)
fimplicit(fun, [xmin xmax ymin ymax])
fimplicit(..., LineSpec)
fimplicit(..., propertyName, propertyValue)
fimplicit(parent, ...)
h = fimplicit(...)
fimplicit samples fun(x,y) and plots the zero contour as an implicitfunctionline graphics object.
When a cell array of function handles is specified, one implicitfunctionline object is created for each function and the returned handle array is a column vector.
See implicitfunctionline properties for the complete property list.
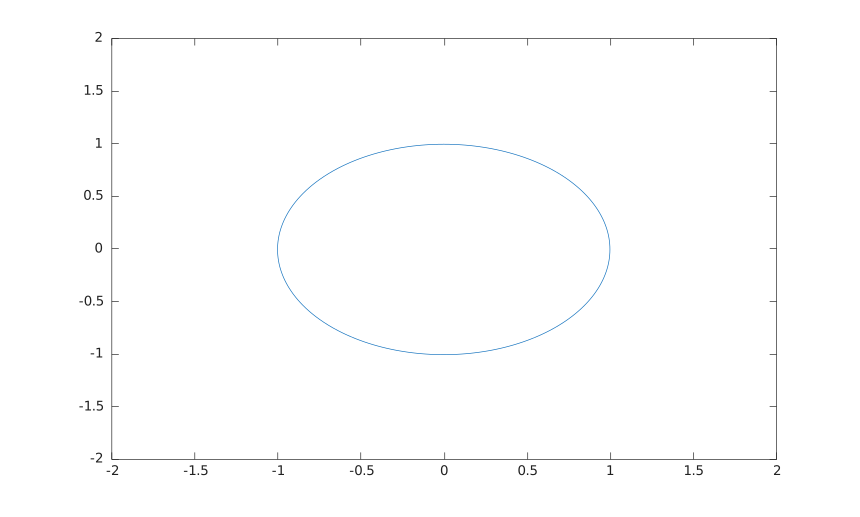
fimplicit(@(x, y) x.^2 + y.^2 - 1, [-2 2 -2 2]);
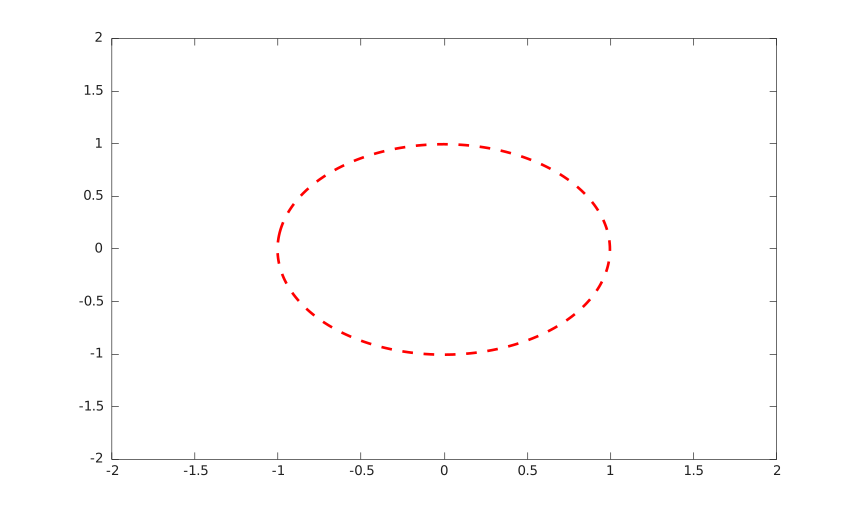
h = fimplicit(@(x, y) x.^2 + y.^2 - 1, [-2 2], '--r', 'LineWidth', 2);
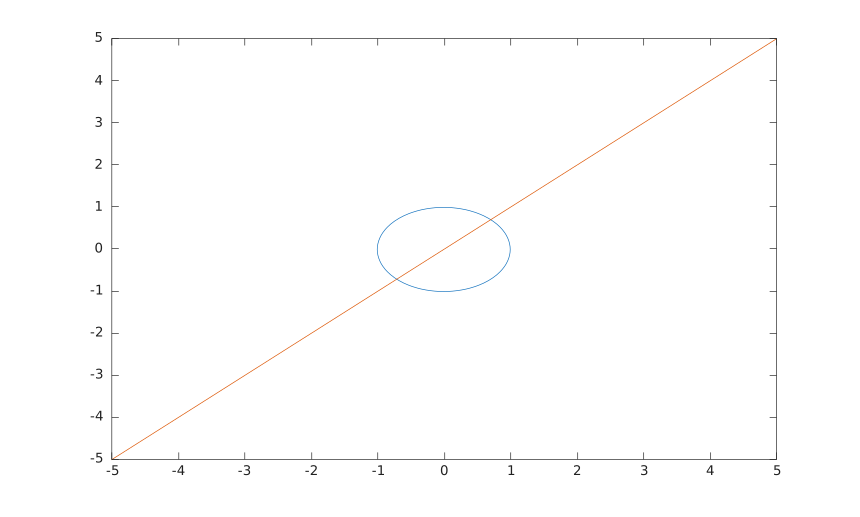
f1 = @(x, y) x.^2 + y.^2 - 1;
f2 = @(x, y) x - y;
h = fimplicit({f1, f2});