contour
Contour plot of matrix
📝Syntax
contour(Z)
contour(X, Y, Z)
contour(..., levels)
contour(..., LineSpec)
contour(ax, ...)
M = contour(...)
[M, h] = contour(...)
📥Input Arguments
Parameter Description
X x-coordinates: vector or matrix.
Y y-coordinates: vector or matrix.
Z z-coordinates: matrix.
levels Contour levels: scalar or vector.
LineSpec Line specification defining line style and color.
ax a scalar graphics object value: parent container specified as an axes.
📤Output Arguments
Parameter Description
M Contour matrix.
h a graphics object: contour type.
📄Description

contour(Z) generates a contour plot representing isolines of the matrix Z. Each isoline corresponds to a specific height value on the x-y plane.

Nelson automatically selects contour lines based on the values in Z. The column and row indices of Z serve as the x and y coordinates in the plane, respectively.

contour(X, Y, Z) allows the user to specify the x and y coordinates corresponding to the values in matrix Z. This enables more precise control over the positioning of the contour plot on the x-y plane.

The matrices X and Y provide the coordinates, while Z contains the height values for generating the contour plot.

See contour properties for the complete property list.

💡Examples
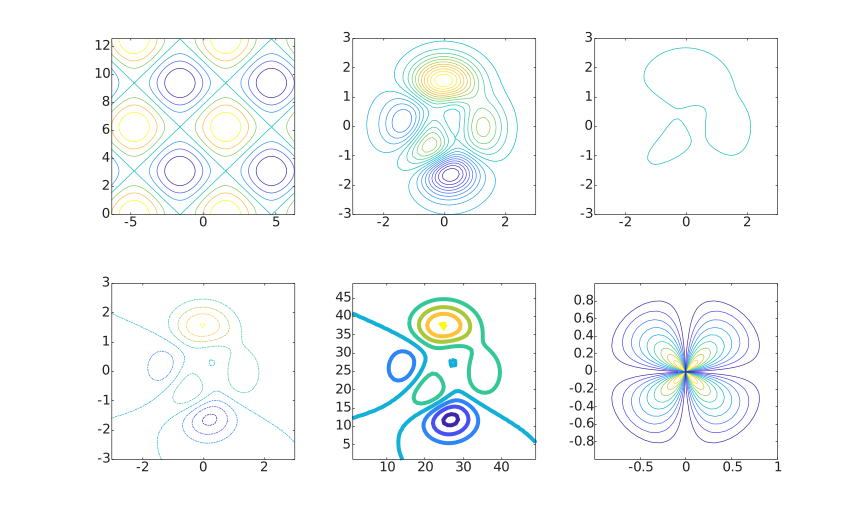
f = figure();
subplot(2, 3, 1)

x = linspace(-2 * pi, 2 * pi);
y = linspace(0, 4 * pi);

[X, Y] = meshgrid(x, y);

Z = sin(X) + cos(Y);

contour(X, Y, Z);

subplot(2, 3, 2)

[X, Y, Z] = peaks;

contour(X, Y, Z, 20)

subplot(2, 3, 3)

[X, Y, Z] = peaks;

v = [1, 1];

contour(X, Y, Z, v)

subplot(2, 3, 4)

[X, Y, Z] = peaks;

contour(X, Y, Z, '-.')

subplot(2, 3, 5)

Z = peaks;

[M, c] = contour(Z);

c.LineWidth = 3;

subplot(2, 3, 6)

[theta, r] = meshgrid(linspace(0, 2 * pi, 64), linspace(0, 1, 64));

[X, Y] = pol2cart(theta, r);

Z = sin(2 * theta) .* (1 - r);

contour(X, Y, abs(Z), 10);
Example illustration
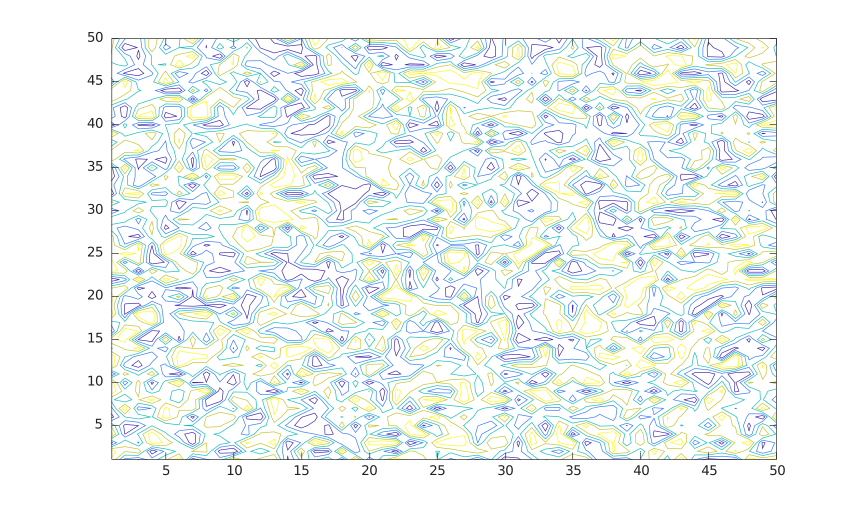
rng('default');
f = figure();
N = 50;
contour(1:N, 1:N, rand(N), 5)
Example illustration
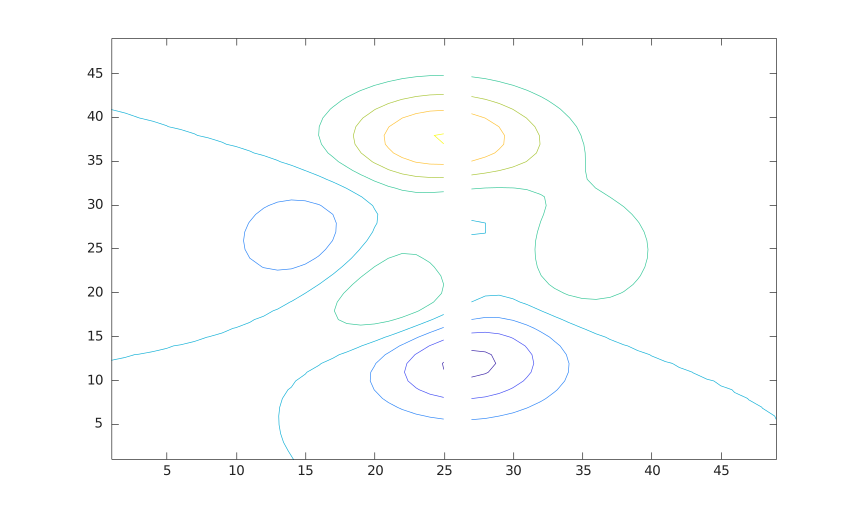
f = figure();
Z = peaks;
Z(:, 26) = NaN;
contour(Z)
Example illustration
Labeled contour lines.
[X, Y, Z] = peaks;

[C, h] = contour(X, Y, Z);

clabel(C, h);
🔗See Also
contour propertiescontourccontourfcontour3clabelsurfmesh
🕔Version History
Version Description
1.3.0 Initial version.
1.7.0 CreateFcn and DeleteFcn callbacks added.
1.8.0 BeingDeleted property added.
Edit this page on GitHub