Examples
Display function contours.
fcontour(@(x, y) x.^2 - y.^2, [-2 2 -2 2]);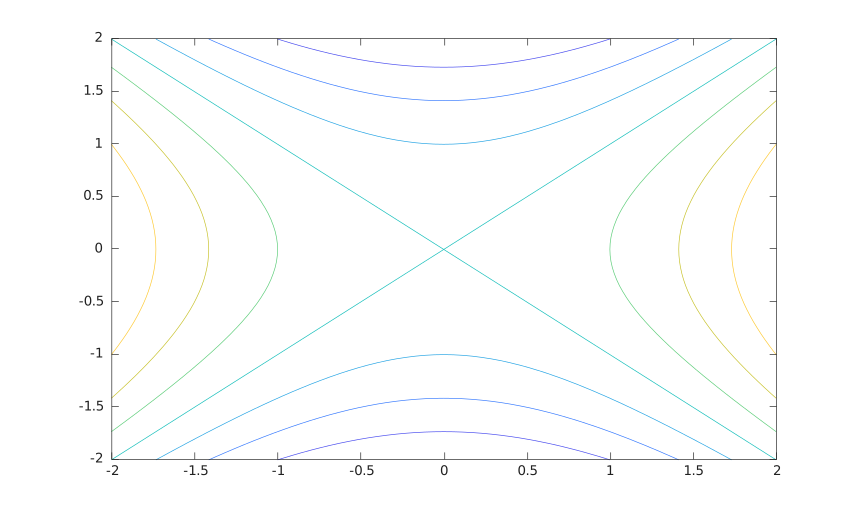
Use a line color and explicit levels.
h = fcontour(@(x, y) x + y, '-r', 'LevelList', [-2 0 2]);
h.LineWidth = 1.5;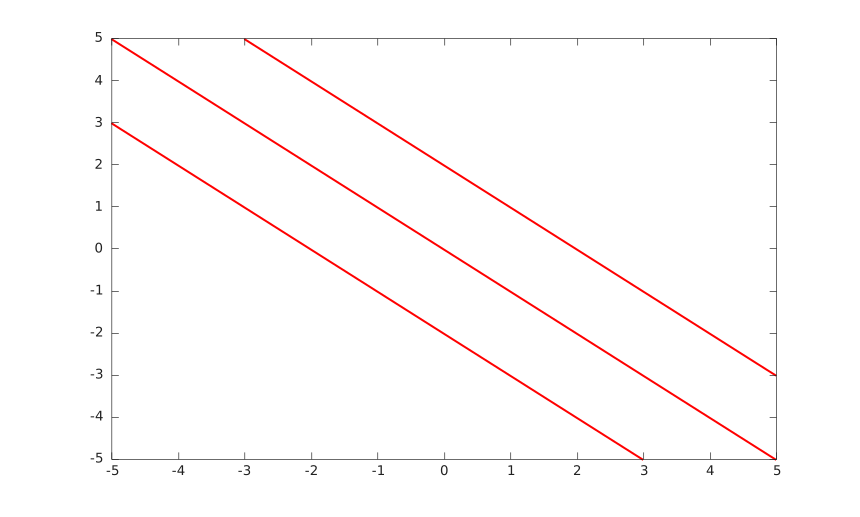
fcontour(fun)
fcontour(fun, xyinterval)
fcontour(fun, [xmin xmax ymin ymax])
fcontour(..., LineSpec)
fcontour(..., propertyName, propertyValue)
fcontour(parent, ...)
h = fcontour(...)
fcontour samples fun(x,y) on a regular grid and displays contour lines as a functioncontour graphics object.
See functioncontour properties for the complete property list.
fcontour(@(x, y) x.^2 - y.^2, [-2 2 -2 2]);h = fcontour(@(x, y) x + y, '-r', 'LevelList', [-2 0 2]);
h.LineWidth = 1.5;