Examples
Display vectors from complex values.
z = [1 + 2i, 2 - 1i, -1 + 1i];
feather(z);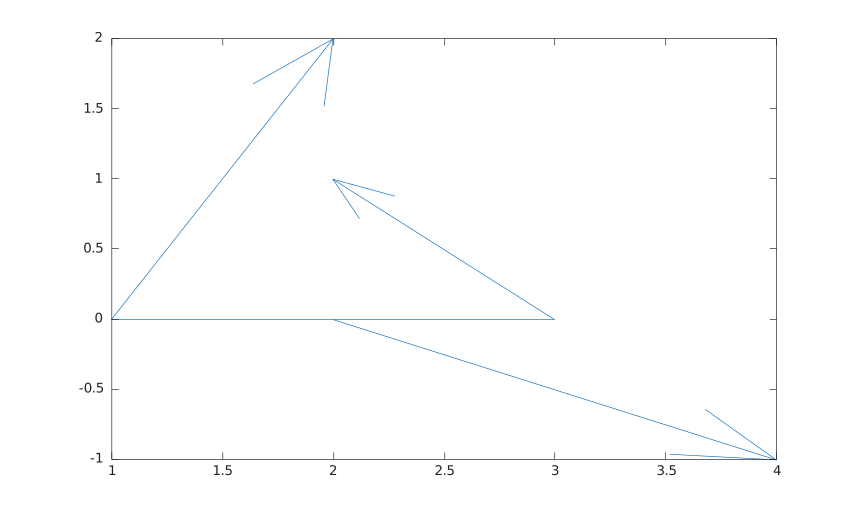
Use line style and line properties.
u = [1 3 2];
v = [2 1 -1];
h = feather(u, v, '-or', 'LineWidth', 1.5);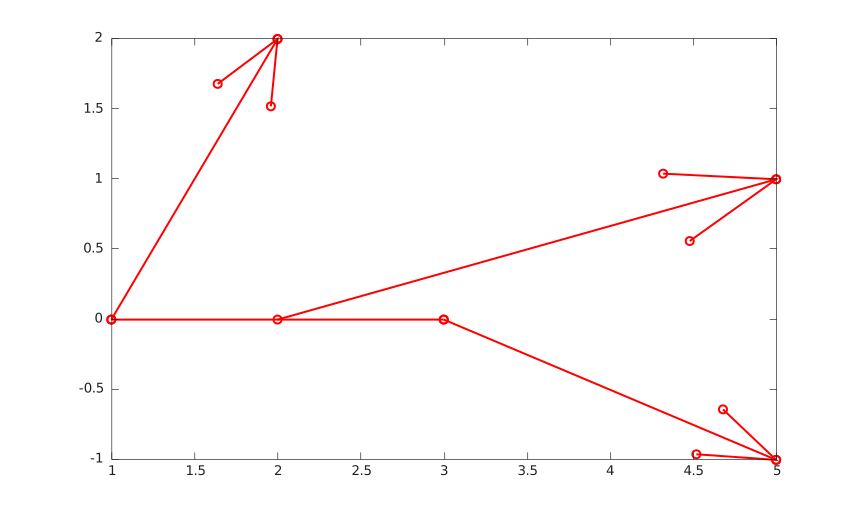
feather(Z)
feather(U, V)
feather(..., LineSpec)
feather(..., propertyName, propertyValue)
feather(parent, ...)
h = feather(...)
feather displays 2-D vectors from y = 0. Complex input uses real parts as horizontal components and imaginary parts as vertical components.
The output is a column vector of line graphics objects: one line for each arrow and one line for the baseline.
z = [1 + 2i, 2 - 1i, -1 + 1i];
feather(z);u = [1 3 2];
v = [2 1 -1];
h = feather(u, v, '-or', 'LineWidth', 1.5);