quiver(U, V)
quiver(X, Y, U, V)
quiver(..., scale)
quiver(..., LineSpec)
quiver(..., propertyName, propertyValue)
quiver(parent, ...)
h = quiver(...)
| Parameter | Description |
|---|---|
| X, Y | Arrow base coordinates, specified as scalars, vectors, or matrices. |
| U, V | Vector components, specified as numeric arrays of the same size. |
| scale | Automatic scale factor. Use 0 to disable automatic scaling. |
| LineSpec | Line style, marker, and color specification. |
| parent | Axes or hggroup parent. |
| propertyName | Scalar string or character vector property name. |
| propertyValue | Property value. |
| Parameter | Description |
|---|---|
| h | Quiver graphics object. |
quiver(U,V) plots arrows with vector components U and V on a regular grid.
quiver(X,Y,U,V) plots arrows at the coordinates specified by X and Y.
See quiver properties for the complete property list.
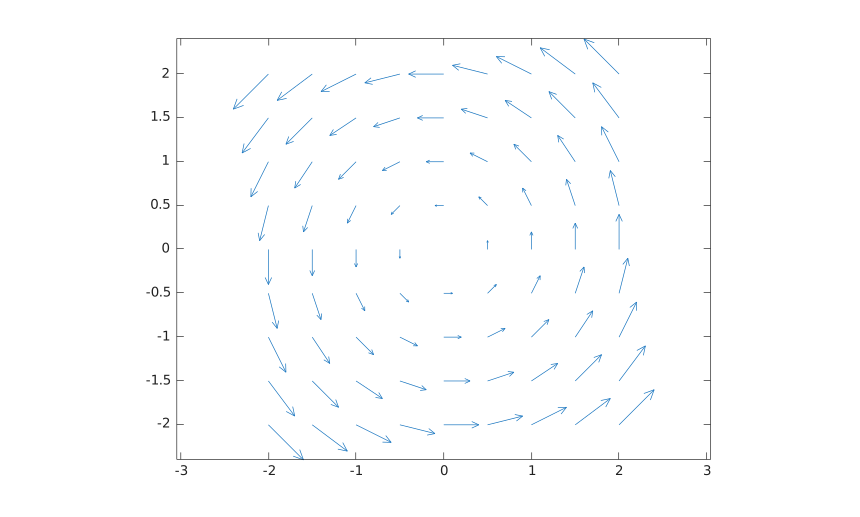
[X, Y] = meshgrid(-2:0.5:2, -2:0.5:2);
U = -Y;
V = X;
h = quiver(X, Y, U, V);
axis equal
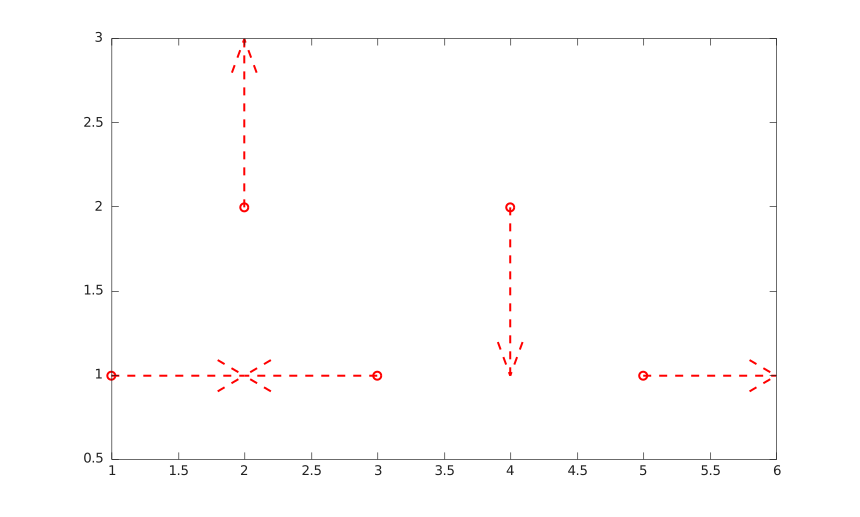
x = 1:5;
y = [1 2 1 2 1];
u = [1 0 -1 0 1];
v = [0 1 0 -1 0];
h = quiver(x, y, u, v, 0, 'r--o', 'LineWidth', 1.5);
h.ShowArrowHead = 'on';
| Version | Description |
|---|---|
| 1.0.0 | initial version |
| 2.0.0 | native quiver graphics object |