Examples
Display complex vectors.
z = [1 + 1i, 1 - 1i, -1 + 0.5i];
compassplot(z);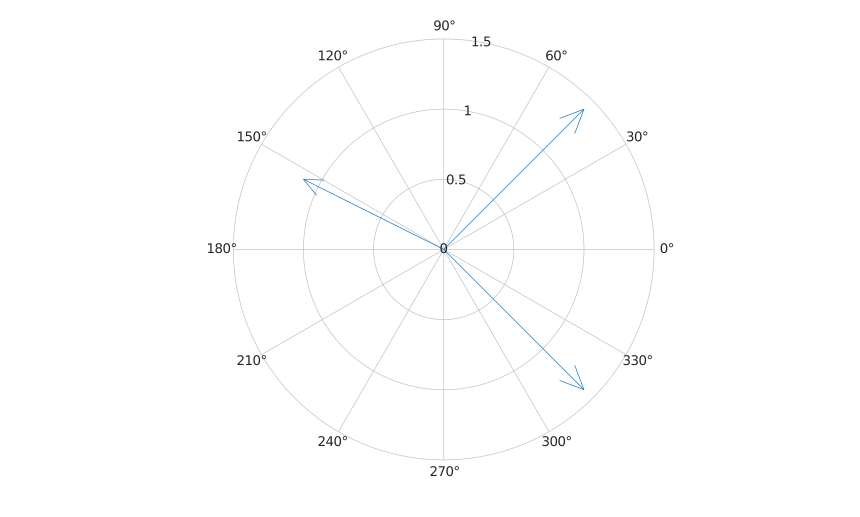
compassplot(z)
compassplot(theta, r)
compassplot(parent, ...)
h = compassplot(...)
compassplot displays complex values or polar coordinate pairs as arrows starting from the origin. The returned handle is a compassplot object.
The compassplot properties page lists the supported object properties.
z = [1 + 1i, 1 - 1i, -1 + 0.5i];
compassplot(z);