polarplot
Plot data in polar coordinates.
📝Syntax
polarplot(rho)
polarplot(theta, rho)
polarplot(theta, rho, LineSpec)
polarplot(..., propertyName, propertyValue, ...)
polarplot(ax, ...)
go = polarplot(...)
📥Input Arguments
Parameter Description
theta Angles in radians: vector or matrix.
rho Radial coordinates: real numeric vector or matrix.
LineSpec Line style, marker, and/or color: character vector or scalar string.
propertyName Line property name: scalar string or row vector of characters.
propertyValue Value assigned to the preceding line property.
ax Target polar axes or axes object. A regular axes is initialized as a polar axes.
📤Output Arguments
Parameter Description
go Column vector of line graphics objects.
📄Description

polarplot(theta, rho) plots radius values rho at angles theta. Data angles are expressed in radians.

polarplot(rho) plots rho versus angles equally spaced from 0 to 2*pi. If rho is complex, angle(rho) is used as angle data and abs(rho) as radius data.

If rho is a matrix, each column is plotted as a separate line. A vector theta can be combined with a matrix rho when its length matches one dimension of rho.

The returned line objects keep polar samples in their ThetaData and RData properties. Cartesian XData and YData are managed by the polar renderer.

Axis limit and tick helper functions use degrees for angular values: thetalim, thetaticks, and thetaticklabels.

When no polar axes is current, polarplot creates one. If a regular axes is supplied, it is initialized as a polar axes.

💡Examples
Plot a polar curve with a line specification.
theta = linspace(0, 2*pi, 200);
rho = 1 + 0.5*cos(4*theta);
polarplot(theta, rho, 'r-', 'LineWidth', 2);
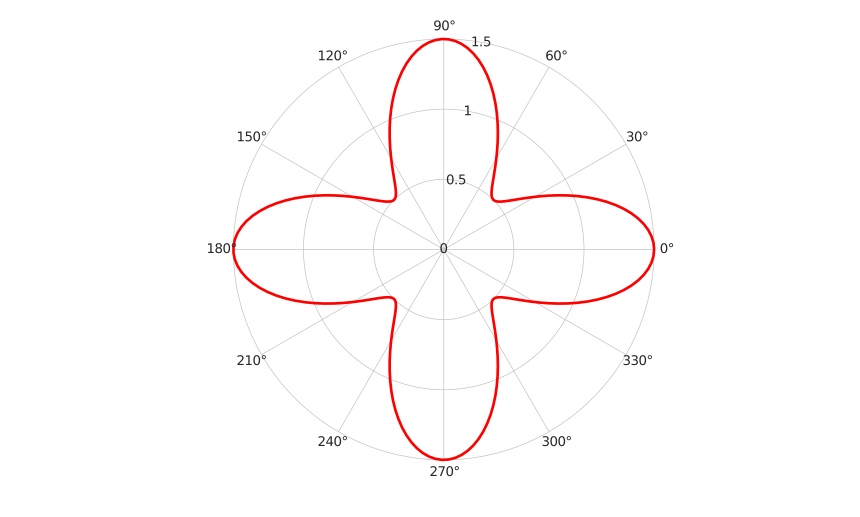
Example illustration
Plot several radius columns on the same polar axes.
theta = linspace(0, 2*pi, 100)';
rho = [sin(theta).^2, cos(theta).^2];
go = polarplot(theta, rho);
rticks([0 0.5 1]);
thetaticks(0:45:360);
Use an explicit polar axes.
f = figure();
ax = polaraxes('Parent', f);
polarplot(ax, linspace(0, pi, 50), linspace(0, 2, 50), 'o-');
rlim(ax, [0 2]);
thetalim(ax, [0 180]);
🔗See Also
polaraxesrlimrticksthetalimthetaticksplotline
🕔Version History
Version Description
2.0.0 initial version
Edit this page on GitHub