Examples
Create a plot matrix for three variables.
X = [1 2 3; 2 3 5; 3 5 8; 4 7 13; 5 11 21];
plotmatrix(X);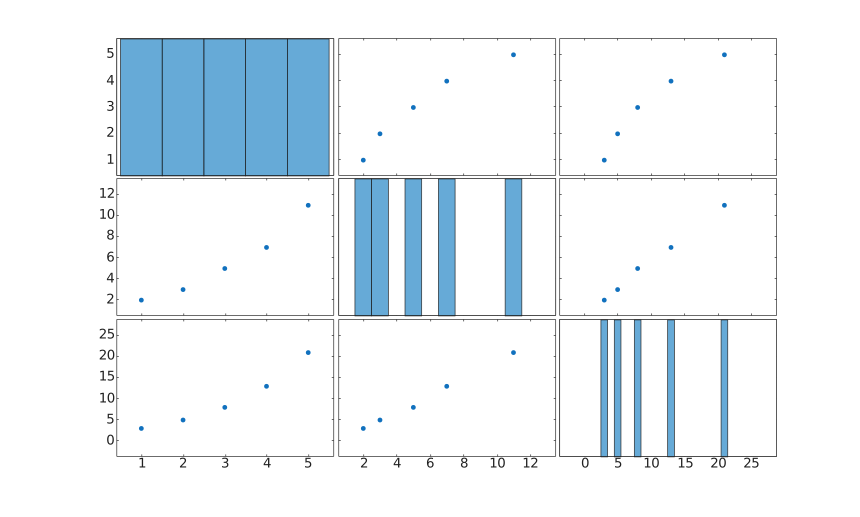
Compare columns from two matrices.
X = rand(30, 2);
Y = [X(:, 1).^2, sin(X(:, 2)), X(:, 1) + X(:, 2)];
plotmatrix(X, Y, 'o');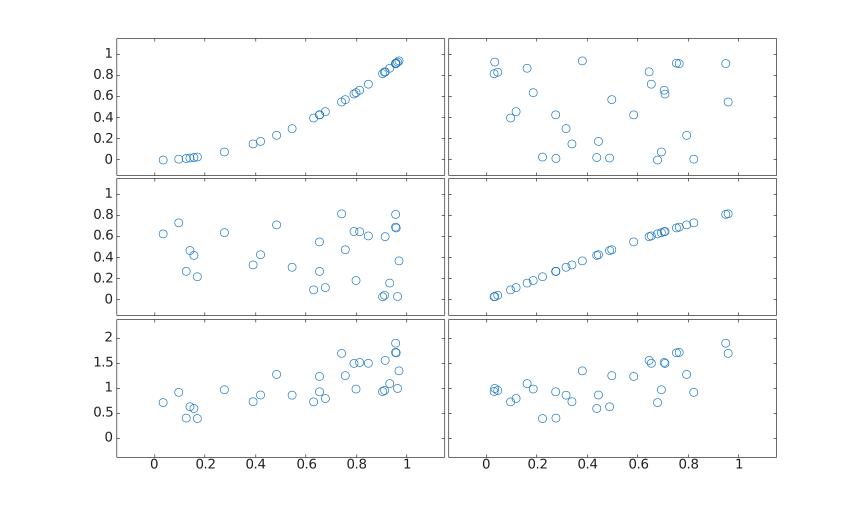
plotmatrix(X)
plotmatrix(X, Y)
plotmatrix(..., marker)
[h, ax, bigax, p, pax] = plotmatrix(...)
plotmatrix creates a grid of pairwise plots for the columns of numeric matrices. With one input matrix, the diagonal cells include histograms returned in p, while h contains the scatter line objects.
X = [1 2 3; 2 3 5; 3 5 8; 4 7 13; 5 11 21];
plotmatrix(X);X = rand(30, 2);
Y = [X(:, 1).^2, sin(X(:, 2)), X(:, 1) + X(:, 2)];
plotmatrix(X, Y, 'o');