histogram2(X, Y)
histogram2(X, Y, nbins)
histogram2(X, Y, xedges, yedges)
histogram2(..., propertyName, propertyValue)
histogram2(ax, ...)
h = histogram2(...)
| Parameter | Description |
|---|---|
| X | x data values. |
| Y | y data values with the same number of elements as X. |
| nbins | number of bins, specified as a scalar or two-element vector. |
| xedges | strictly increasing x bin edges. |
| yedges | strictly increasing y bin edges. |
| propertyName | histogram2 object property name. |
| propertyValue | histogram2 object property value. |
| ax | target axes object. |
| Parameter | Description |
|---|---|
| h | histogram2 graphics object. |
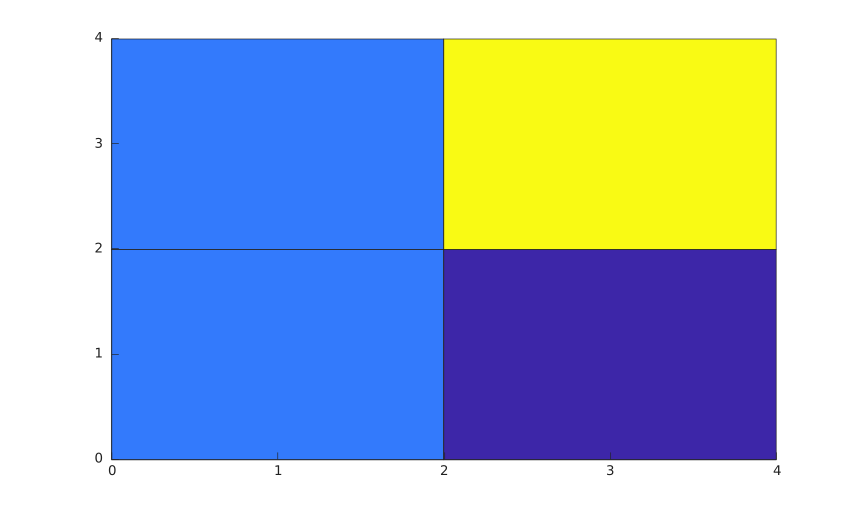
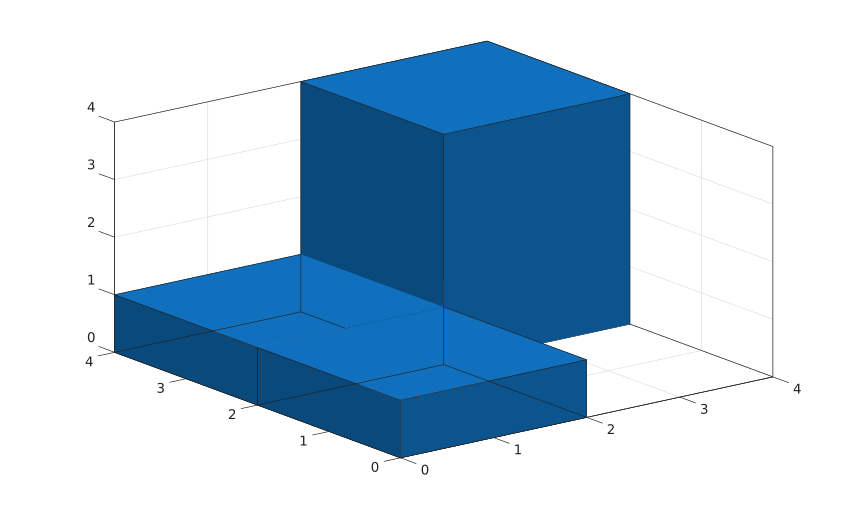
histogram2 bins paired numeric data and displays the bin values as 3-D bars or a tiled surface.
See histogram2 properties for the complete property list.
x = [1 1 2 3 4 4];
y = [1 2 2 3 3 4];
histogram2(x, y, [0 2 4], [0 2 4]);
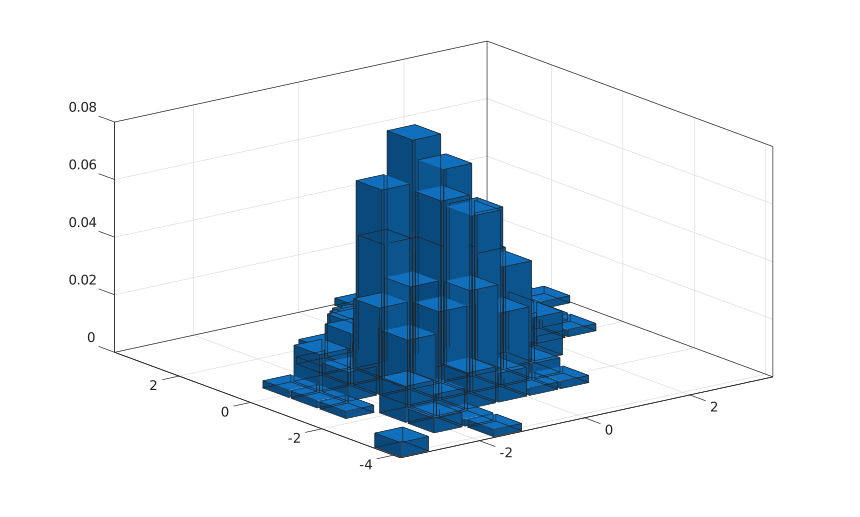
x = randn(400, 1);
y = 0.5 * x + randn(400, 1);
histogram2(x, y, [12 10], 'Normalization', 'probability');
x = [1 1 2 3 4 4];
y = [1 2 2 3 3 4];
h = histogram2(x, y, [0 2 4], [0 2 4], 'DisplayStyle', 'tile');
h.ShowEmptyBins = 'on';