polarscatter
Display scatter points in polar coordinates.
📝Syntax
polarscatter(theta, rho)
polarscatter(theta, rho, sz)
polarscatter(theta, rho, sz, color)
polarscatter(tbl, thetavar, rhovar)
polarscatter(parent, ...)
h = polarscatter(...)
📄Description

polarscatter displays marker data using polar angle and radius values.

Table input selects theta and radius data from variables in tbl. Multiple selected variables create multiple scatter objects.

💡Examples
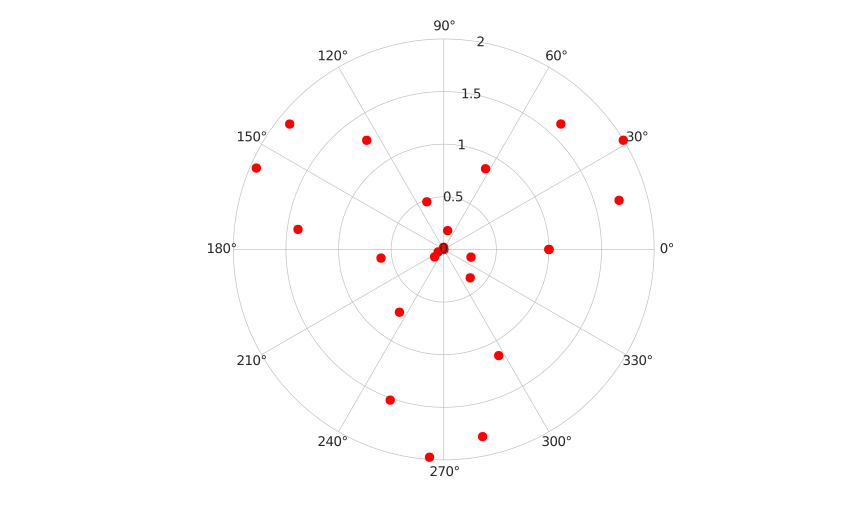
Display filled polar markers.
theta = linspace(0, 2*pi, 24);
rho = 1 + sin(3 * theta);
polarscatter(theta, rho, 49, 'r', 'filled');
Example illustration
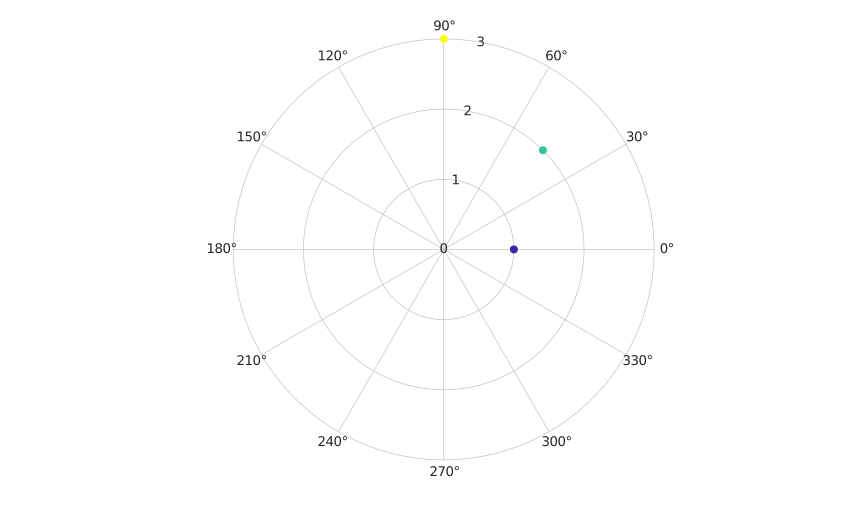
Create a polar scatter chart from a table.
t = table([0; pi/4; pi/2], [1; 2; 3], 'VariableNames', {'theta', 'rho'});
h = polarscatter(t, 'theta', 'rho', 'filled');
Example illustration
🔗See Also
polarplotpolarbubblechart
Edit this page on GitHub