polarbubblechart(theta, rho, sz)
polarbubblechart(theta, rho, sz, color)
polarbubblechart(tbl, thetavar, rhovar, szvar)
polarbubblechart(tbl, thetavar, rhovar, szvar, colorvar)
polarbubblechart(parent, ...)
h = polarbubblechart(...)
polarbubblechart displays polar markers whose size is controlled by bubble size data.
Table input selects theta, radius, size, and optional color data from variables in tbl. Multiple selected variables create multiple bubblechart objects.
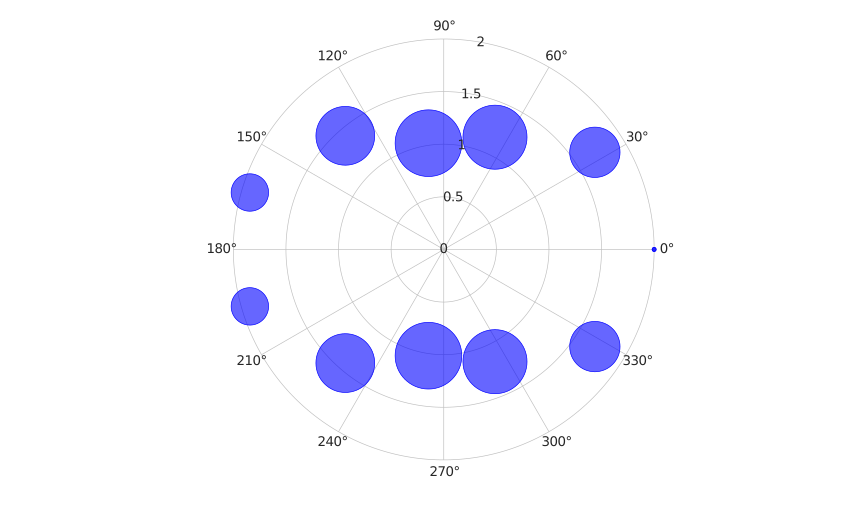
theta = linspace(0, 2*pi, 12);
rho = 1 + cos(theta).^2;
sz = 20 + 60 * abs(sin(theta));
polarbubblechart(theta, rho, sz, 'b');
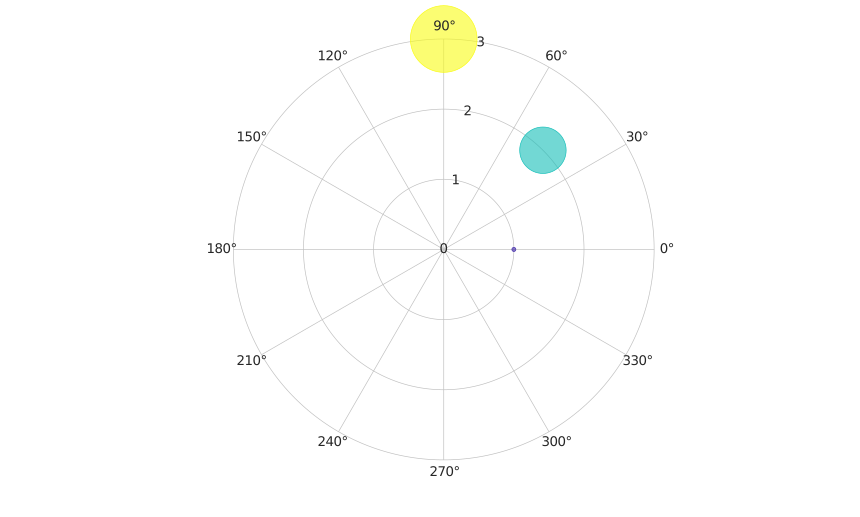
t = table([0; pi/4; pi/2], [1; 2; 3], [25; 36; 49], [1; 2; 3], ...
'VariableNames', {'theta', 'rho', 'sz', 'c'});
h = polarbubblechart(t, 'theta', 'rho', 'sz', 'c');