Examples
Create a polar axes and plot into it.
ax = polaraxes();
theta = linspace(0, 2*pi, 80);
polarplot(ax, theta, 1 + sin(theta));
rlim(ax, [0 2]);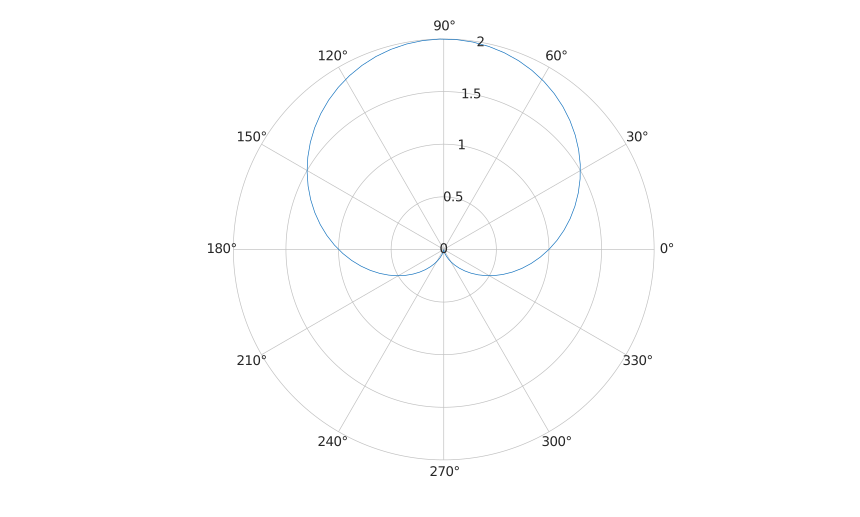
polaraxes()
polaraxes(propertyName, propertyValue, ...)
ax = polaraxes(...)
| Parameter | Description |
|---|---|
| propertyName | Axes property name: scalar string or row vector of characters. |
| propertyValue | Value assigned to the preceding axes property. |
| Parameter | Description |
|---|---|
| ax | Axes graphics object initialized for polar plotting. |
polaraxes creates an axes object and initializes it for polar coordinate rendering.
The polar state is stored on the axes and contains radial limits, angular limits, tick values, tick labels, grid handles, and plotted data handles.
The axes remains an axes graphics object. Use polarplot to add polar data and use rlim, rticks, rticklabels, thetalim, thetaticks, and thetaticklabels to customize polar decorations.
See polaraxes properties for the complete property list.
ax = polaraxes();
theta = linspace(0, 2*pi, 80);
polarplot(ax, theta, 1 + sin(theta));
rlim(ax, [0 2]);| Version | Description |
|---|---|
| 2.0.0 | initial version |