line
Create primitive line.
📝Syntax
go = line()
po = line(x, y)
go = line(x, y, z)
go = line(ax, x, y, z)
go = line(ax, x, y, z, propertyName, propertyValue)
📥Input Arguments
Parameter Description
x, y , z a scalar graphics object value: parent container, specified as a figure.
ax Target axes: axes object.
propertyName a scalar string or row vector character.
propertyValue a value.
📤Output Arguments
Parameter Description
go a graphics object: line type.
📄Description

line(x, y) creates a line in the current axes with vectorsx and y.

line(x, y, z) creates a line in three-dimensional coordinates.

See line properties for the complete property list.

BeingDeleted Flag indicating that the object is being deleted.

💡Examples
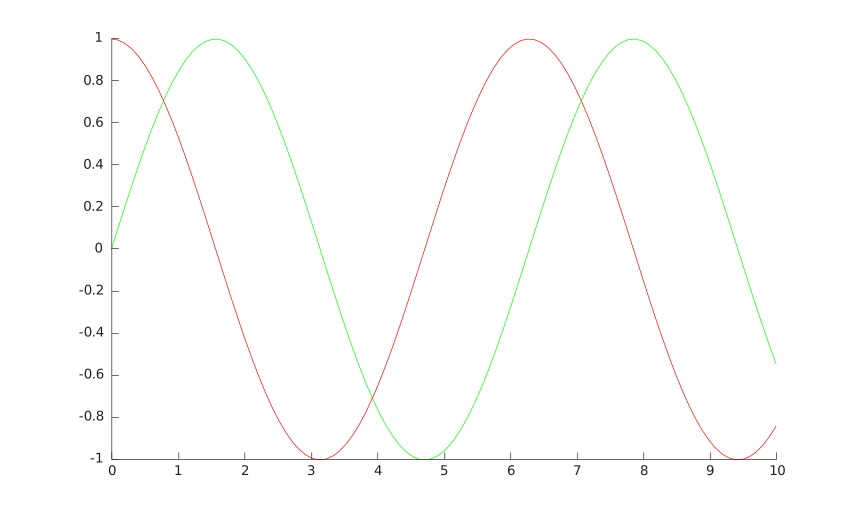
f = figure();
x = linspace(0,10)';
y1 = sin(x);
y2 = cos(x);
line(x, y1, 'Color', [0 1 0])
line(x, y2, 'Color', [1 0 0])
Example illustration
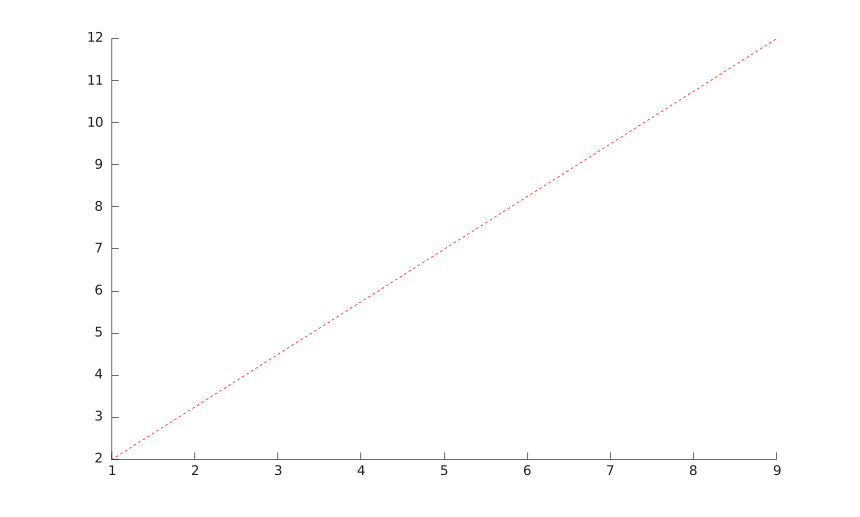
f = figure();
x = [1 9];
y = [2 12];
line(x,y,'Color','red','LineStyle','--')
Example illustration
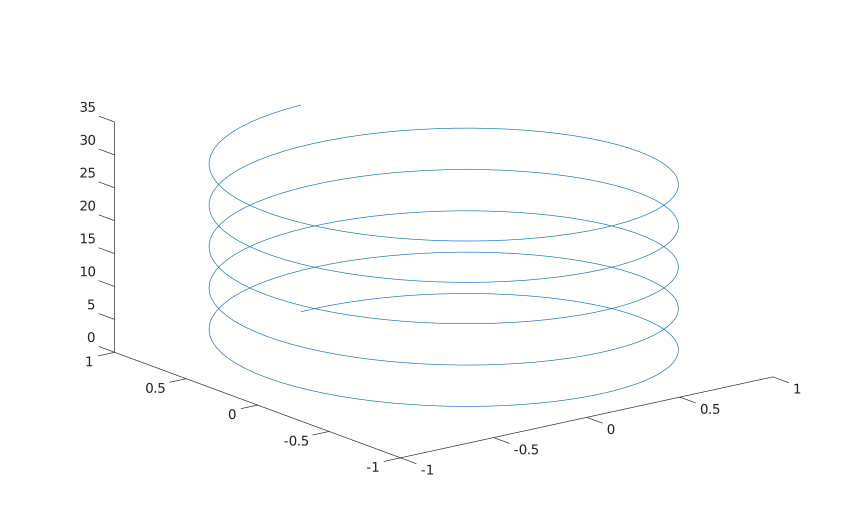
f = figure();
t = linspace(0,10*pi,400);
x = sin(t);
y = cos(t);
z = t;
line(x,y,z)
view(3)
Example illustration
🔗See Also
line propertiesplotplot3
🕔Version History
Version Description
1.0.0 initial version
1.7.0 CreateFcn, DeleteFcn callback added.
-- BeingDeleted property added.
-- Polar line properties added.
Edit this page on GitHub