Examples
Create a polar histogram.
theta = 2*pi*rand(200, 1);
polarhistogram(theta, 16);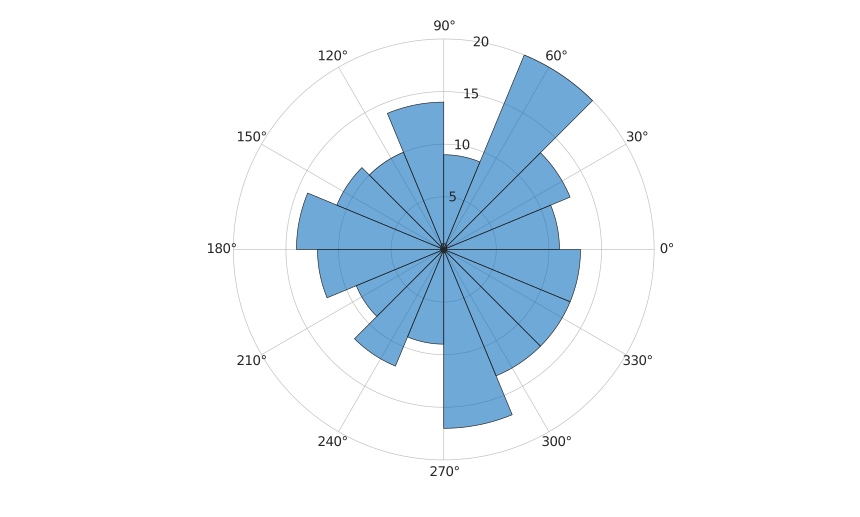
polarhistogram(theta)
polarhistogram(theta, nbins)
polarhistogram(..., 'BinEdges', edges)
h = polarhistogram(...)
polarhistogram bins angle data and displays the bin counts as polar sectors.
theta = 2*pi*rand(200, 1);
polarhistogram(theta, 16);