Examples
Plot a polar function.
fpolarplot(@(t) 1 + sin(4*t), [0 2*pi], 'r-');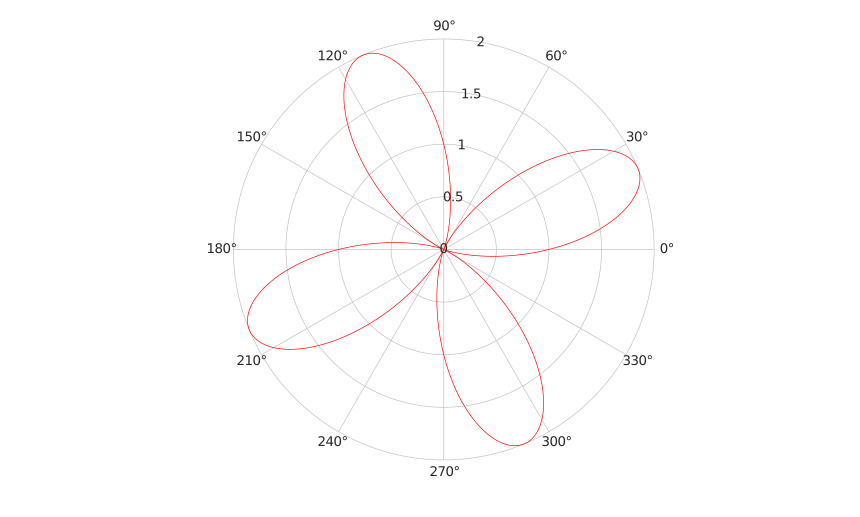
fpolarplot(fun)
fpolarplot(fun, [tmin tmax])
fpolarplot(..., LineSpec)
fpolarplot(..., Name, Value)
fpolarplot(parent, ...)
h = fpolarplot(...)
| Parameter | Description |
|---|---|
| h | Function line graphics object drawn in polar axes. |
fpolarplot samples a function over an angle interval and plots the resulting radius values in polar coordinates. The returned object is a functionline.
Name-value pairs can set line properties and functionline properties such as MeshDensity.
fpolarplot(@(t) 1 + sin(4*t), [0 2*pi], 'r-');