Examples
fplot(@(x) sin(x), [0 2*pi]);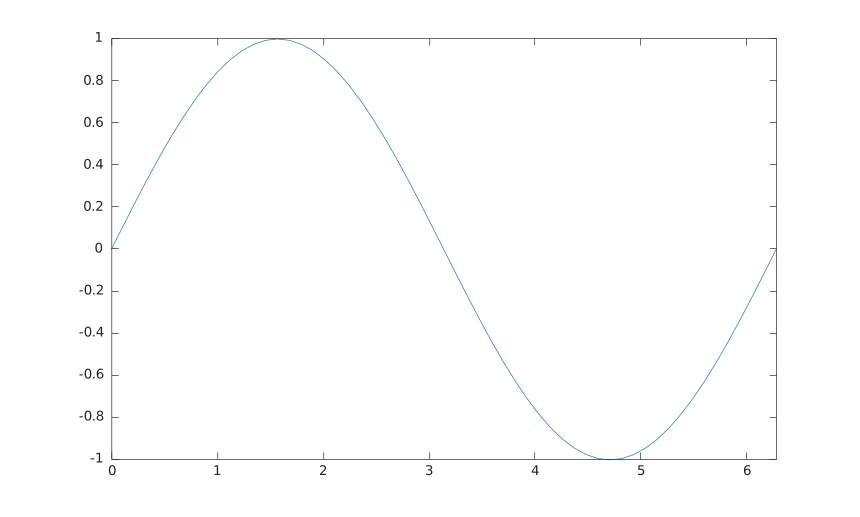
fplot(@(x) exp(-x.^2), [-3 3], '-r', 'LineWidth', 1.5);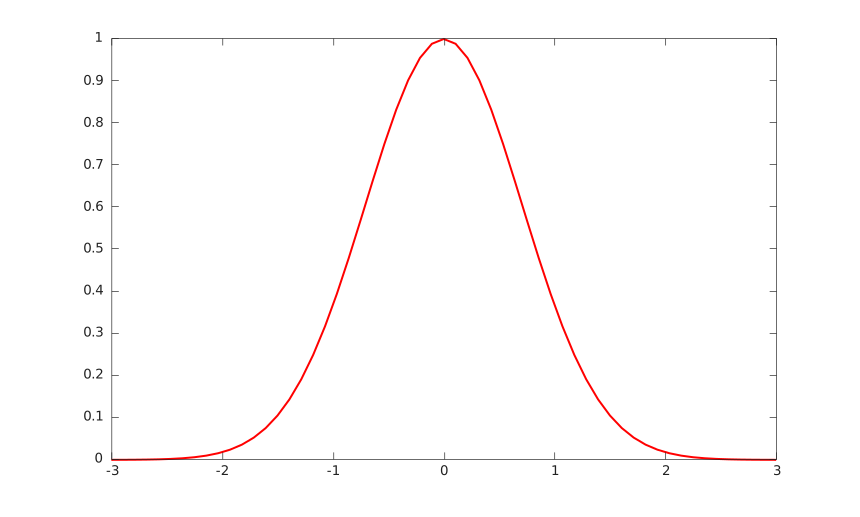
fplot(@(t) cos(t), @(t) sin(t), [0 2*pi]);
axis equal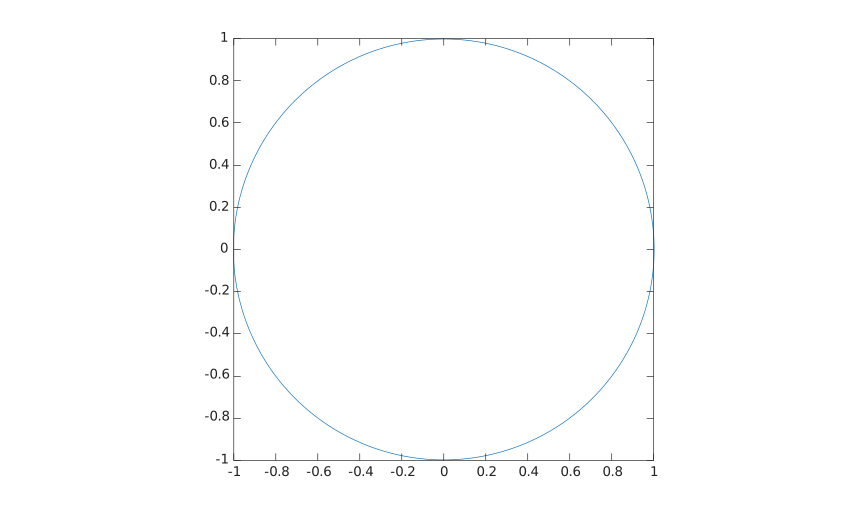
fplot(f)
fplot(f, [xmin xmax])
fplot(xfun, yfun)
fplot(xfun, yfun, [tmin tmax])
fplot(..., lineSpec)
fplot(..., propertyName, propertyValue)
fplot(ax, ...)
h = fplot(...)
| Parameter | Description |
|---|---|
| f | function handle evaluated on x values. |
| xfun | function handle evaluated on parameter values to produce x data. |
| yfun | function handle evaluated on parameter values to produce y data. |
| lineSpec | line style, marker, and color specification. |
| propertyName | line property name. |
| propertyValue | line object property value. |
| ax | target axes object. |
| Parameter | Description |
|---|---|
| h | functionline graphics object for y = f(x), or parameterizedfunctionline graphics object for x = x(t), y = y(t). |
fplot samples functions over a finite range and plots the result as a function graphics object. The default range is [-5 5].
For y = f(x), fplot returns a functionline object. For parametric curves, it returns a parameterizedfunctionline object.
See functionline properties and parameterizedfunctionline properties for the complete property lists.
fplot(@(x) sin(x), [0 2*pi]);fplot(@(x) exp(-x.^2), [-3 3], '-r', 'LineWidth', 1.5);fplot(@(t) cos(t), @(t) sin(t), [0 2*pi]);
axis equal