contourf
Filled contour plot of matrix
📝Syntax
contourf(Z)
contourf(X, Y, Z)
contourf(..., levels)
contourf(..., LineSpec)
contourf(ax, ...)
M = contourf(...)
[M, h] = contourf(...)
📥Input Arguments
Parameter Description
X x-coordinates: vector or matrix.
Y y-coordinates: vector or matrix.
Z z-coordinates: numeric matrix.
levels Contour levels: scalar count, vector of levels, or [k k] for one level.
LineSpec Line style and color.
ax Parent axes.
📤Output Arguments
Parameter Description
M Contour matrix.
h Contour graphics object.
📄Description

contourf draws filled contour bands for the values in Z. The returned contour matrix matches the object's ContourMatrix property.

The contour object supports line, fill, transparency, label, and contour-level properties including FaceColor, FaceAlpha, ShowText, LabelColor, LabelSpacing, LabelFormat, TextList, TextStep, and ZLocation.

💡Examples
Draw filled contours.
figure();
[X,Y,Z] = peaks(40);
[M,h] = contourf(X,Y,Z,10);
h.FaceAlpha = 0.75;
Draw filled contours.
x = linspace(-2*pi, 2*pi, 100);
y = linspace(-2*pi, 2*pi, 100);
[X, Y] = meshgrid(x, y);
Z = sin(X) .* cos(Y);
figure;
contourf(X, Y, Z, 20);
colorbar;
title('Demo contourf');
xlabel('X');
ylabel('Y');
colormap parula;
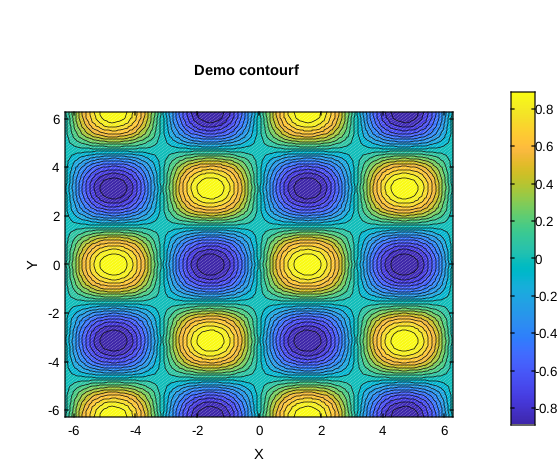
Example illustration
🔗See Also
contourcontourccontour3clabel
🕔Version History
Version Description
1.17.0 initial version
Edit this page on GitHub