Examples
f = figure();
subplot(2, 3, 1)

x = linspace(-2 * pi, 2 * pi);
y = linspace(0, 4 * pi);

[X, Y] = meshgrid(x, y);

Z = sin(X) + cos(Y);

contour(X, Y, Z);

subplot(2, 3, 2)

[X, Y, Z] = peaks;

contour(X, Y, Z, 20)

subplot(2, 3, 3)

[X, Y, Z] = peaks;

v = [1, 1];

contour(X, Y, Z, v)

subplot(2, 3, 4)

[X, Y, Z] = peaks;

contour(X, Y, Z, '-.')

subplot(2, 3, 5)

Z = peaks;

[M, c] = contour(Z);

c.LineWidth = 3;

subplot(2, 3, 6)

[theta, r] = meshgrid(linspace(0, 2 * pi, 64), linspace(0, 1, 64));

[X, Y] = pol2cart(theta, r);

Z = sin(2 * theta) .* (1 - r);

contour(X, Y, abs(Z), 10);
rng('default');
f = figure();
N = 50;
contour(1:N, 1:N, rand(N), 5)
f = figure();
Z = peaks;
Z(:, 26) = NaN;
contour(Z)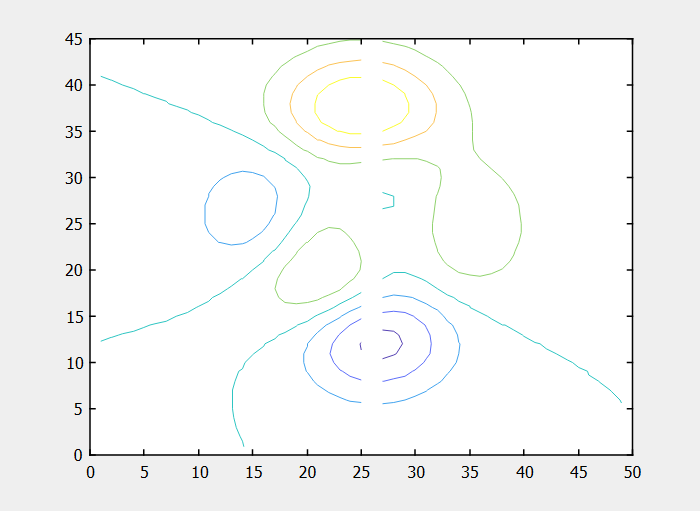
Labeled contour lines.
[X, Y, Z] = peaks;

[C, h] = contour(X, Y, Z);

clabel(C, h);