subtitle
Add subtitle.
📝Syntax
subtitle(text)
subtitle(target, text)
subtitle(..., propertyName, propertyValue)
go = subtitle(...)
📥Input Arguments
Parameter Description
text Text to display: character vector, string scalar, string array, or cell array of character vectors.
target An axes or tiled layout graphics object, or an array of objects of the same supported class.
propertyName Subtitle object property name.
propertyValue Subtitle object property value.
📤Output Arguments
Parameter Description
go A subtitle graphics object, or an array of subtitle graphics objects.
📄Description

subtitle adds the subtitle to the current axes or to the specified target.

When the target already has a subtitle text object, subtitle updates and returns that object.

For axes targets, the subtitle text uses data units and follows the axes title horizontal alignment.

For tiled layout targets, the returned object exposes the tiled layout text properties.

String arrays and cell arrays of character vectors are stored as multiple subtitle lines.

Property name and value pairs are applied to the subtitle object.

The Visible property is inherited from the parent axes when a new subtitle text object is created.
💡Examples
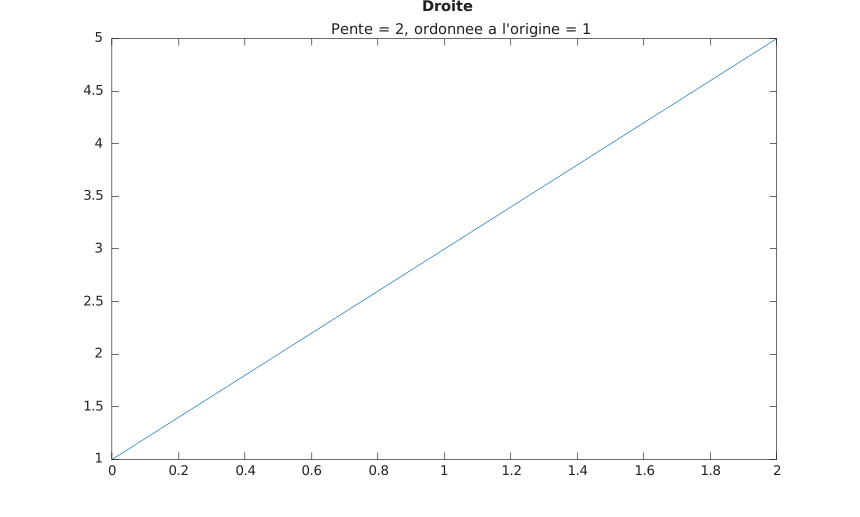
Add a subtitle to a plot.
f = figure();
plot([0 2], [1 5]);
title('Straight Line');
subtitle('Slope = 2, y-Intercept = 1');
Example illustration
Set subtitle properties.
f = figure();
plot([0 2], [1 5]);
title('Straight Line');
subtitle('Slope = 2, y-Intercept = 1', 'Color', 'red');
🔗See Also
titletexttiledlayout
🕔Version History
Version Description
2.0.0 initial version
Edit this page on GitHub