Examples
2-by-2 tiled layout
t = tiledlayout(2, 2);
ax1 = nexttile;
plot(ax1, 1:10, (1:10).^2);
ax2 = nexttile;
plot(ax2, 1:10, sqrt(1:10));
t.TileSpacing = 'compact';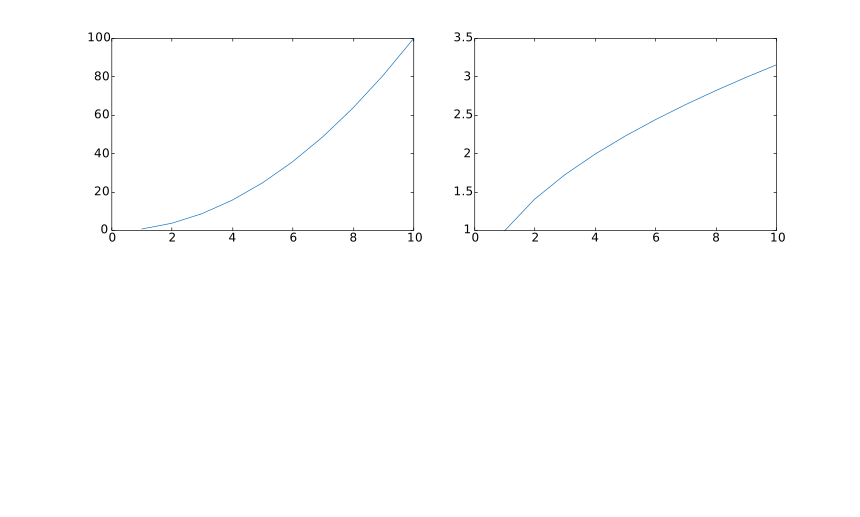
t = tiledlayout
t = tiledlayout(m, n)
t = tiledlayout(arrangement)
t = tiledlayout(parent, ...)
t = tiledlayout(..., propertyName, propertyValue)
| Parameter | Description |
|---|---|
| m | Number of tile rows: positive integer. |
| n | Number of tile columns: positive integer. |
| arrangement | 'flow' or 'vertical' or 'horizontal': automatic arrangement mode. |
| parent | Parent figure handle. |
| propertyName | Property name: 'TileSpacing', 'Padding', 'TileIndexing', or other layout property. |
| propertyValue | Property value corresponding to the property name. |
| Parameter | Description |
|---|---|
| t | TiledChartLayout graphics object. |
tiledlayout creates a tiled chart layout in the current figure for displaying multiple plots in a grid arrangement.
tiledlayout with no input arguments creates a flow layout.
tiledlayout(m, n) creates a layout with m rows and n columns of tiles.
tiledlayout('flow') creates a layout that automatically adjusts the grid as axes are added. tiledlayout('vertical') stacks axes from top to bottom, and tiledlayout('horizontal') stacks axes from left to right.
Use nexttile to create axes within the layout.
See tiledlayout properties for the complete property list.
t = tiledlayout(2, 2);
ax1 = nexttile;
plot(ax1, 1:10, (1:10).^2);
ax2 = nexttile;
plot(ax2, 1:10, sqrt(1:10));
t.TileSpacing = 'compact';| Version | Description |
|---|---|
| 1.17.0 | initial version |