ax = uiaxes()
ax = uiaxes(parent)
ax = uiaxes(..., propertyName, propertyValue)
| Parameter | Description |
|---|---|
| parent | parent container. |
| propertyName, propertyValue | name-value pairs. |
| Parameter | Description |
|---|---|
| ax | axes object. |
ax = uiaxes creates axes suitable for uifigure based apps and returns the axes object. It behaves like axes with UIAxes defaults: Units = 'pixels', Position = [10 10 400 300], NextPlot = 'replacechildren', FontUnits = 'pixels'. Pass the axes to plotting functions: plot(ax, ...).
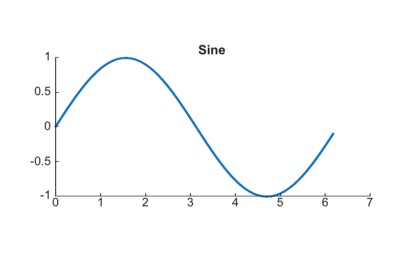
f = uifigure('Visible', 'off', 'Name', 'Axes UI', 'Position', [100 100 420 260]);
f.HandleVisibility = 'on';
ax = uiaxes(f, 'Position', [45 45 330 175]);
x = 0:0.1:2*pi;
plot(ax, x, sin(x), 'LineWidth', 1.5);
title(ax, 'Sine');
drawnow();
f = uifigure();
ax = uiaxes(f, 'Position', [30 30 400 300]);
plot(ax, 1:10, (1:10).^2);
| Version | Description |
|---|---|
| 2.0.0 | initial version |