Examples
f = figure();
data = peaks(50);
ax1 = subplot(1, 2, 1);
s1 = surface(ax1, data);
ax2 = subplot(1, 2, 2);
s2 = surf(ax2, data);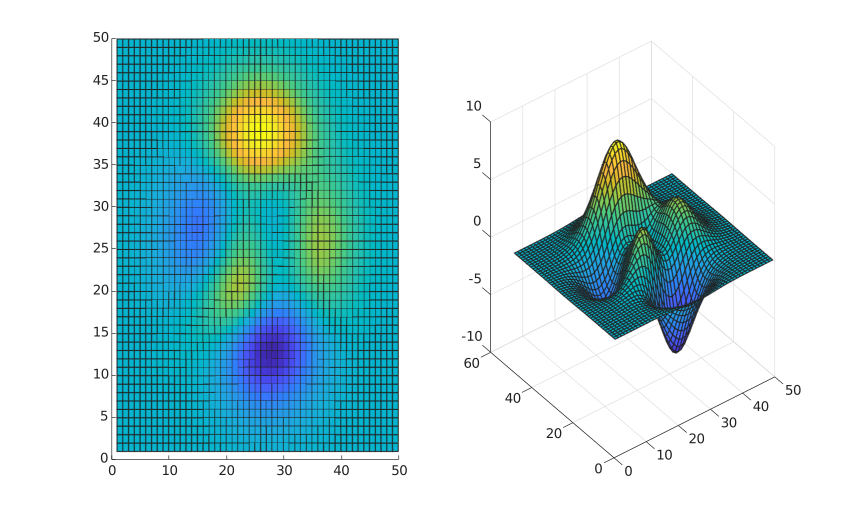
surface(X, Y, Z)
surface(X, Y, Z, C)
surface(Z)
surface(Z, C)
surface(parent, ...)
surface(..., propertyName, propertyValue)
go = surface(...)
| Parameter | Description |
|---|---|
| X | x-coordinates: vector or matrix. |
| Y | y-coordinates: vector or matrix. |
| Z | z-coordinates: vector or matrix. |
| C | Color array: m-by-n-by-3 array of RGB triplets. |
| parent | a scalar graphics object value: parent container, specified as a axes. |
| propertyName | a scalar string or row vector character. |
| propertyValue | a value. |
| Parameter | Description |
|---|---|
| go | a graphics object: surface type. |
surf andsurface functions are both used to create 3D surface plots, but there are some slight differences between the two.
surf function is used to plot a surface defined by a function of two variables, or by a set of scattered data points.
It requires three input arguments: X, Y, and Z. X and Y define the coordinates of the data points, and Z defines the height of the surface at each point.
surf function also applies high-level plot setup such as axes replacement, 3D view, and grid defaults.
surface function creates a primitive surface object in the current or specified axes.
The size of Z must match the size of X and Y. The surface function also provides additional options for customizing the appearance of the plot, such as lighting and color.
In summary, both surf andsurface functions are used for 3D surface plots butsurf is used for a surface defined by a function of two variables or by a set of scattered data points, while surface is used for a surface defined by a matrix of data, and the size of Z must match the size of X and Y.
See surface properties for the complete property list.
f = figure();
data = peaks(50);
ax1 = subplot(1, 2, 1);
s1 = surface(ax1, data);
ax2 = subplot(1, 2, 2);
s2 = surf(ax2, data);| Version | Description |
|---|---|
| 1.0.0 | initial version |