Examples
Display two slices through a volume.
[x, y, z] = meshgrid(-2:2, -2:2, -2:2);
v = x.^2 + y.^2 + z.^2;
slice(x, y, z, v, 0, [], 0);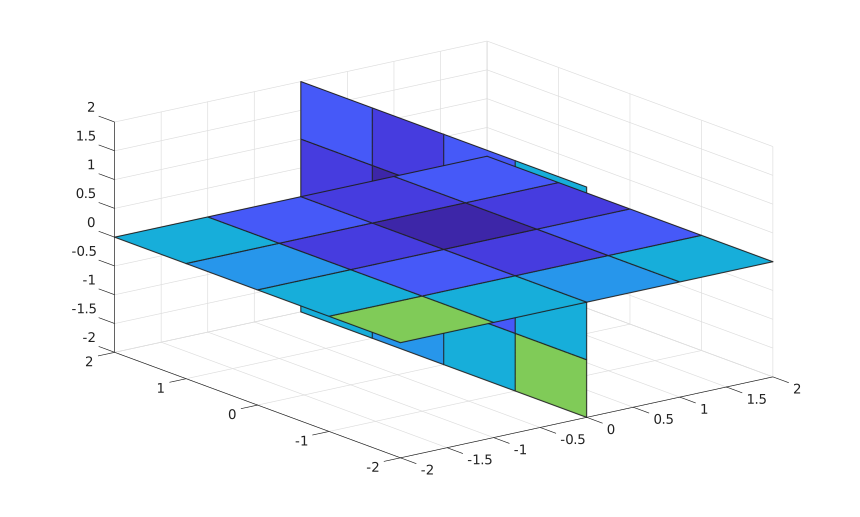
slice(V, xs, ys, zs)
slice(V, XI, YI, ZI)
slice(X, Y, Z, V, xs, ys, zs)
slice(X, Y, Z, V, XI, YI, ZI)
slice(..., method)
slice(parent, ...)
h = slice(...)
| Parameter | Description |
|---|---|
| V | Numeric 3-D volume data. |
| X, Y, Z | Volume grid coordinates or vectors. |
| xs, ys, zs | Slice locations along the x, y, and z axes. Use [] to omit an axis. |
| XI, YI, ZI | Arrays defining a slice surface through the volume. |
| method | Interpolation method: 'linear', 'nearest', or 'cubic'. The default is 'linear'. |
| Parameter | Description |
|---|---|
| h | Surface handles for the generated slices. |
slice samples volume data on requested planes or on a requested surface and displays each result as a surface colored by interpolated values.
[x, y, z] = meshgrid(-2:2, -2:2, -2:2);
v = x.^2 + y.^2 + z.^2;
slice(x, y, z, v, 0, [], 0);