Examples
fsurf(@(x, y) sin(x) + cos(y), [-3 3 -3 3], 'FaceColor', 'interp', 'EdgeColor', 'none', 'ShowContours', 'on');
light();
lighting gouraud;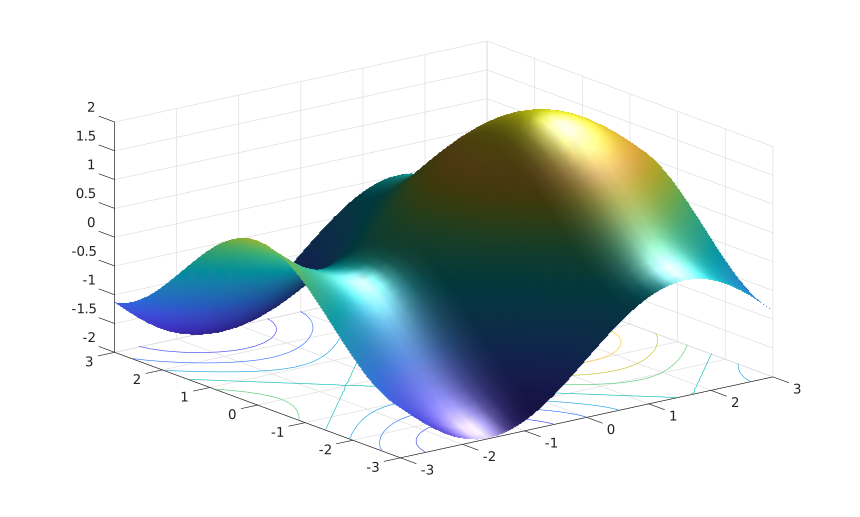
fsurf(fun)
fsurf(fun, range)
fsurf(ax, ...)
fsurf(..., propertyName, propertyValue)
go = fsurf(...)
| Parameter | Description |
|---|---|
| fun | function handle evaluated as fun(X, Y). |
| range | two element range for both axes or four element [xmin xmax ymin ymax]. |
| MeshDensity | number of sample points in each direction. |
| XRange, YRange | sampling intervals. Changing either range after creation resamples the function surface. |
| XRangeMode, YRangeMode | auto for the default range, manual after an explicit range assignment. |
| ShowContours | set to on to add contour lines under the function surface. |
| Parameter | Description |
|---|---|
| go | a graphics object: functionsurface type. |
fsurf samples a function on a rectangular grid and displays the result as a function surface object. The grid is resampled when Function, XRange, YRange, or MeshDensity changes.
See functionsurface properties for the complete property list.
fsurf(@(x, y) sin(x) + cos(y), [-3 3 -3 3], 'FaceColor', 'interp', 'EdgeColor', 'none', 'ShowContours', 'on');
light();
lighting gouraud;| Version | Description |
|---|---|
| 2.0.0 | initial version |