piechart(data)
piechart(data, names)
piechart(fig, ...)
piechart(..., propertyName, propertyValue)
p = piechart(...)
| Parameter | Description |
|---|---|
| data | Numeric vector of wedge values. Negative, infinite, and NaN values are ignored for display. |
| names | String array, character vector, or cell array of character vectors used as wedge names. |
| fig | Figure parent. |
| propertyName | Pie chart property name. |
| propertyValue | Value assigned to the named property. |
| Parameter | Description |
|---|---|
| p | Pie chart graphics object. |
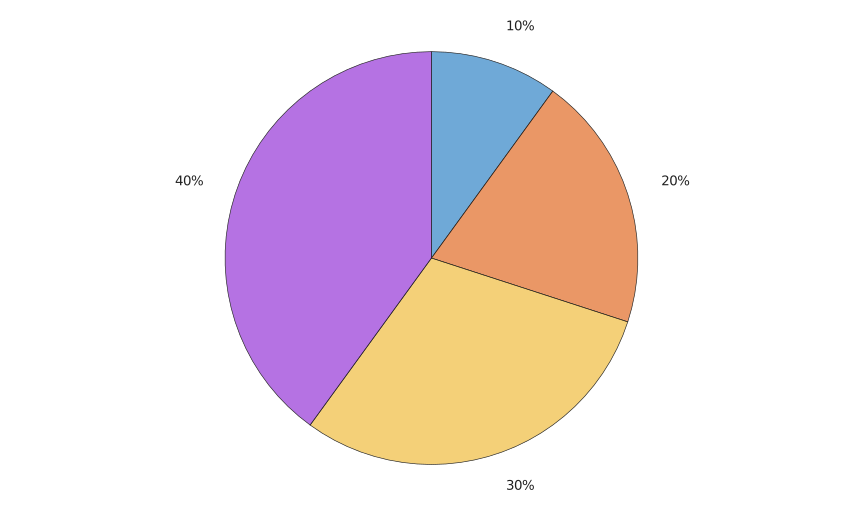
piechart(data) creates one pie chart object in the current figure.
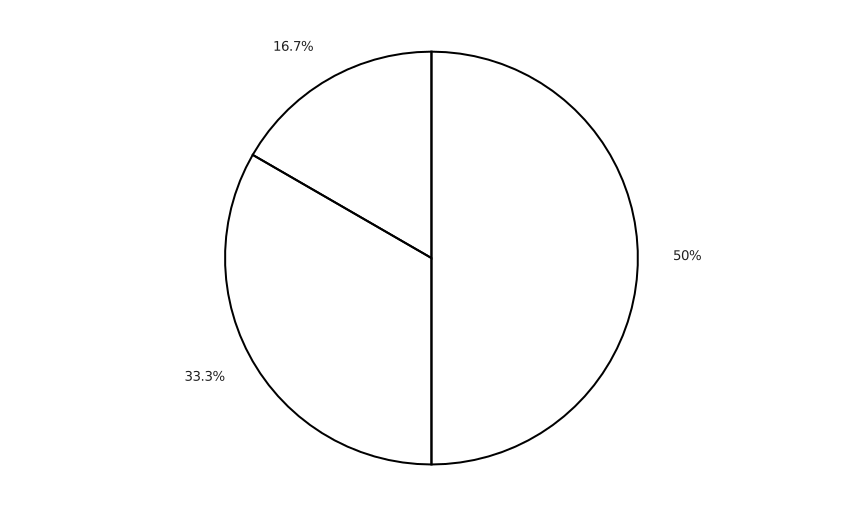
FaceColor can be flat, none, or an RGB color. FaceAlpha, EdgeColor, and LineWidth affect the rendered wedges. Proportions, CategoryCounts, WedgeDisplayData, and WedgeDisplayNames are read-only derived properties.
See piechart properties for the complete property list.
figure('Color', [1 1 1]);
p = piechart([1 2 3 4]);
figure('Color', [1 1 1]);
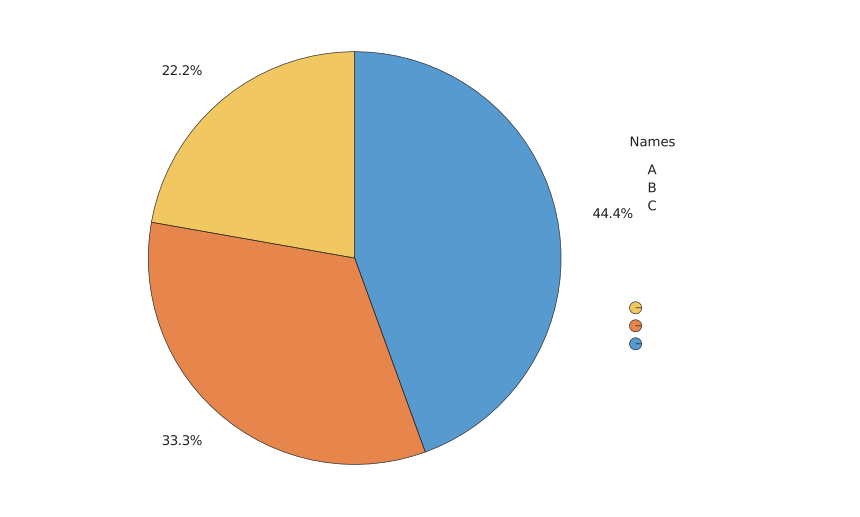
p = piechart([4 3 2], ["A", "B", "C"], 'LegendVisible', 'on', ...
'LegendTitle', 'Names', 'FaceAlpha', 0.7);
figure('Color', [1 1 1]);
p = piechart([3 2 1], 'FaceColor', 'none', 'EdgeColor', [0 0 0], ...
'LineWidth', 2);
| Version | Description |
|---|---|
| 2.0.0 | initial version |