donutchart(data)
donutchart(data, names)
donutchart(fig, ...)
donutchart(..., propertyName, propertyValue)
d = donutchart(...)
| Parameter | Description |
|---|---|
| data | Numeric vector of wedge values. |
| names | String array, character vector, or cell array of character vectors used as wedge names. |
| fig | Figure parent. |
| propertyName | Donut chart property name. |
| propertyValue | Value assigned to the named property. |
| Parameter | Description |
|---|---|
| d | Donut chart graphics object. |
donutchart(data) creates one donut chart object in the current figure.
InnerRadius controls the hole radius as a fraction of the outer radius. CenterLabel draws text in the center of the hole.
See donutchart properties for the complete property list.
figure('Color', [1 1 1]);
d = donutchart([4 3 2], ["A", "B", "C"], 'CenterLabel', '9');
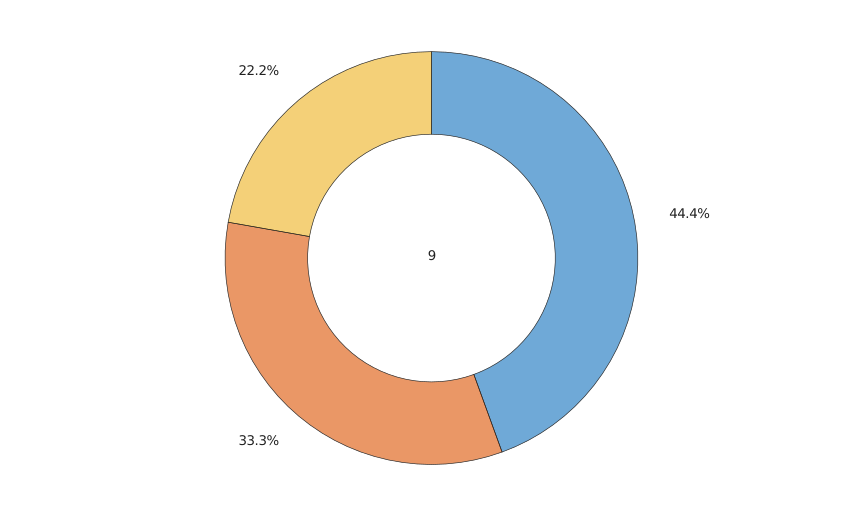
figure('Color', [1 1 1]);
d = donutchart([5 4 3 2], 'InnerRadius', 0.35, 'FaceAlpha', 0.75, ...
'ColorOrder', [0.8 0.2 0.2; 0.2 0.7 0.3; 0.2 0.4 0.8]);
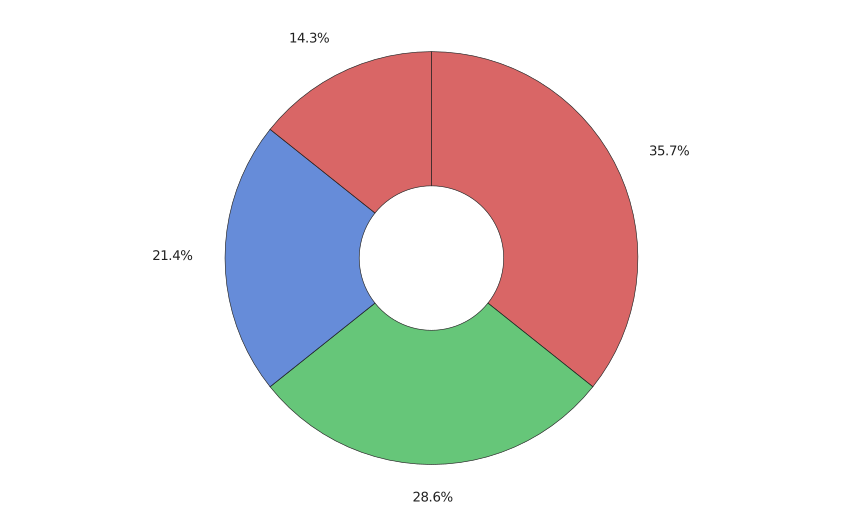
| Version | Description |
|---|---|
| 2.0.0 | initial version |