bar3
Display a 3-D vertical bar chart.
📝Syntax
bar3(Y)
bar3(Z, Y)
bar3(..., width)
bar3(..., 'detached')
bar3(..., 'grouped')
bar3(..., 'stacked')
bar3(..., color)
bar3(parent, ...)
h = bar3(...)
📥Input Arguments
Parameter Description
Y Numeric vector or matrix of bar heights.
Z row positions for the bars.
width Relative bar width. The default value is 0.8.
color color name or short color name for the bar faces.
📤Output Arguments
Parameter Description
h surface graphics object or vector of surface graphics objects.
📄Description

bar3 displays columns as 3-D cuboids. Matrix columns are shown along the x direction and matrix rows along the y direction.

Use 'grouped' to group matrix columns at each row position and 'stacked' to stack matrix columns at each row position.

💡Examples
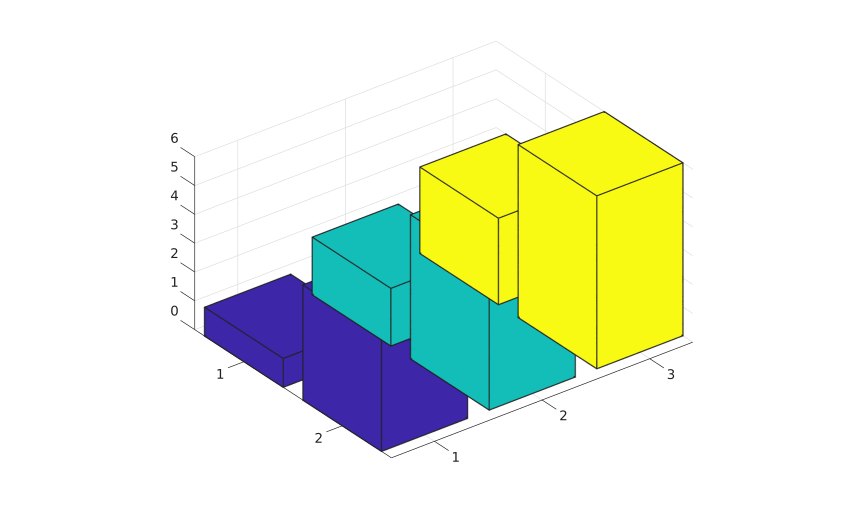
Detached 3-D bars from a matrix.
f = figure();
Y = [1 2 3; 4 5 6];
bar3(Y);
Example illustration
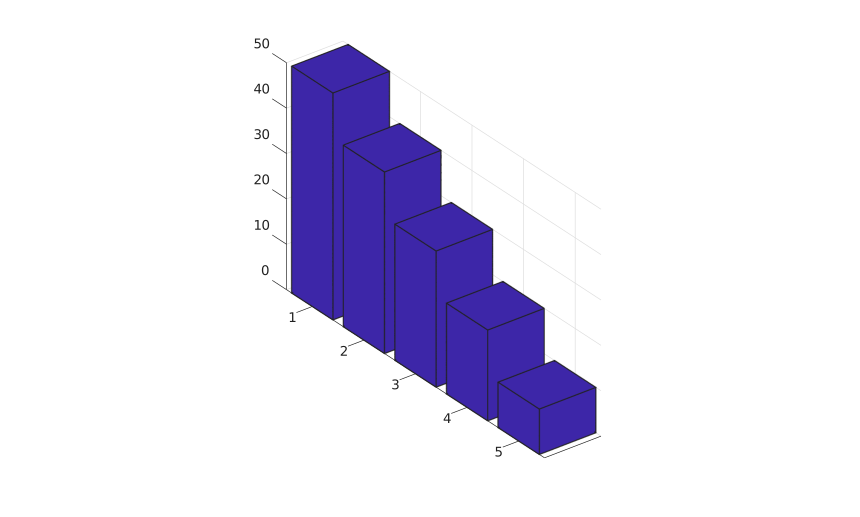
3-D bars from a vector.
f = figure();
z = [50 40 30 20 10];
bar3(z);
Example illustration
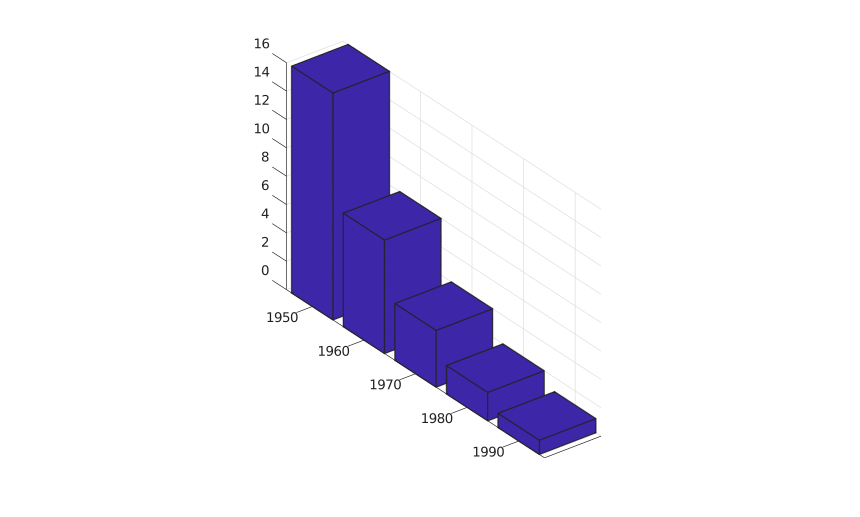
3-D bars with explicit row positions.
f = figure();
z = [1950 1960 1970 1980 1990];
y = [16 8 4 2 1];
bar3(z, y);
Example illustration
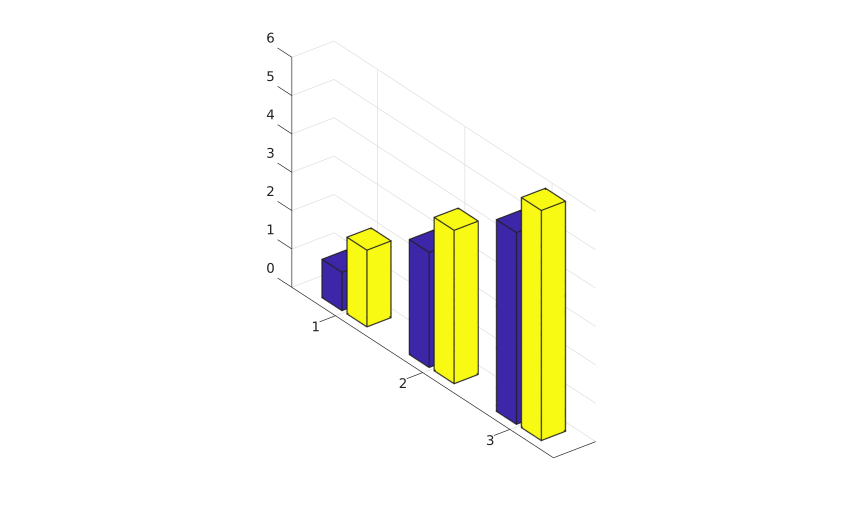
Grouped 3-D bars.
f = figure();
y = [1 2; 3 4; 5 6];
bar3(y, 'grouped');
Example illustration
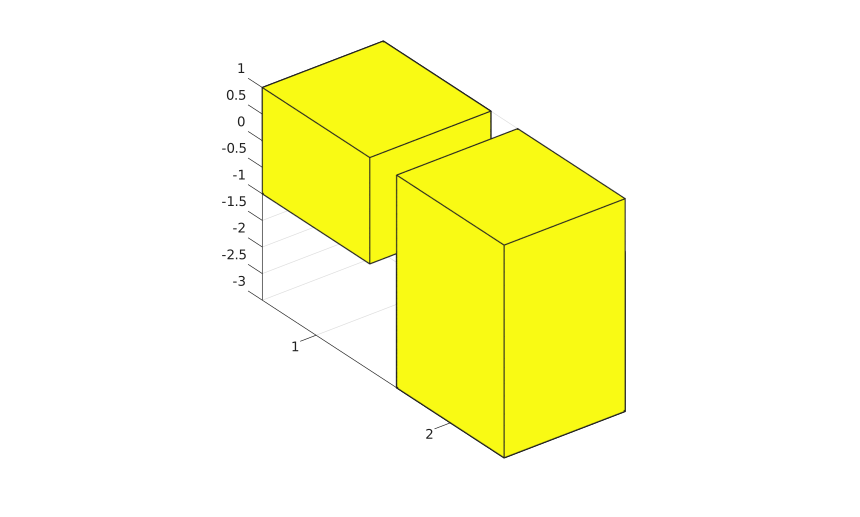
Stacked 3-D bars with positive and negative values.
f = figure();
y = [1 -2; -3 4];
bar3(y, 'stacked');
Example illustration
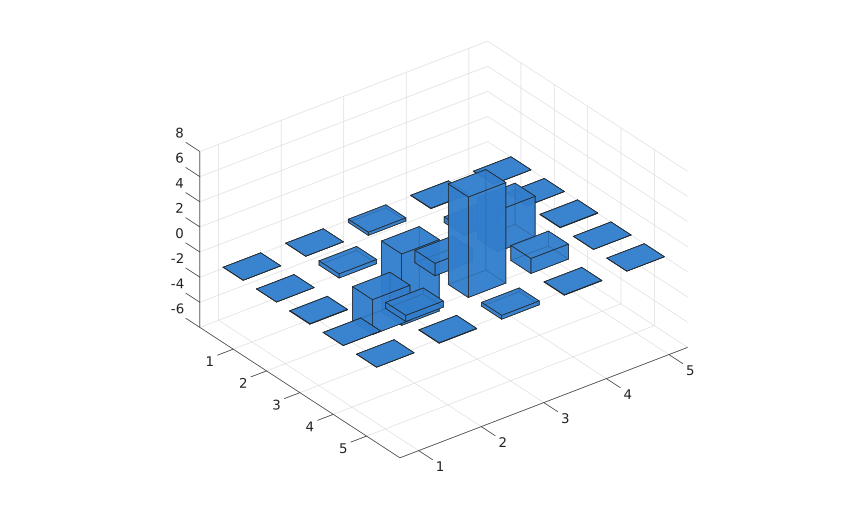
Set color and transparency.
f = figure();
h = bar3(peaks(5), 0.6);
set(h, 'FaceColor', [0.2 0.5 0.8], 'FaceAlpha', 0.8);
Example illustration
🔗See Also
barbar3hsurface
Edit this page on GitHub