quiver3
3-D vector field plot.
📝Syntax
quiver3(Z, U, V, W)
quiver3(X, Y, Z, U, V, W)
quiver3(..., scale)
quiver3(..., LineSpec)
quiver3(..., propertyName, propertyValue)
quiver3(parent, ...)
h = quiver3(...)
📥Input Arguments
Parameter Description
X, Y, Z Arrow base coordinates, specified as scalars, vectors, matrices, or arrays that match the vector component size.
U, V, W Vector components, specified as numeric arrays of the same size.
scale Automatic scale factor. Use 0 to disable automatic scaling.
LineSpec Line style, marker, and color specification.
parent Axes or hggroup parent.
propertyName Scalar string or character vector property name.
propertyValue Property value.
📤Output Arguments
Parameter Description
h Quiver graphics object.
📄Description

quiver3(Z,U,V,W) plots 3-D arrows on a regular x-y grid using Z as the z-coordinate data.

quiver3(X,Y,Z,U,V,W) plots arrows at the coordinates specified by X, Y, and Z.

The returned object has type quiver. Its public properties include XData, YData, ZData, UData, VData, WData, AutoScale, AutoScaleFactor, ScaleFactor, Color, LineStyle, LineWidth, Marker, MarkerSize, MaxHeadSize, ShowArrowHead, Alignment, DisplayName, and common graphics interaction properties.

💡Examples
Plot a 3-D vector field.
[x, y, z] = meshgrid(-1:1, -1:1, -1:1);
u = y;
v = -x;
w = z;
quiver3(x, y, z, u, v, w);
axis equal
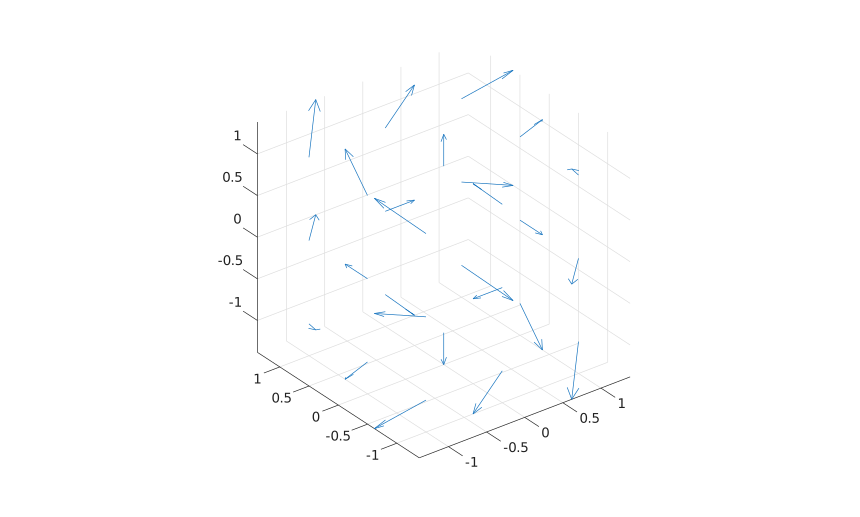
Example illustration
Disable automatic scaling and style the arrows.
x = [0 1 2];
y = [0 1 0];
z = [0 0 1];
u = [1 0 -1];
v = [0 1 0];
w = [0.5 0.5 1];
h = quiver3(x, y, z, u, v, w, 0, 'r--o');
h.LineWidth = 1.5;
Plot surface normals as 3-D arrows.
[X,Y] = meshgrid(-2:0.25:2,-1:0.2:1);
Z = X.*exp(-X.^2 - Y.^2);
[U,V,W] = surfnorm(X,Y,Z);
quiver3(X,Y,Z,U,V,W)
hold on
surf(X,Y,Z)
axis equal
🔗See Also
quiverplot3meshgrid
🕔Version History
Version Description
2.0.0 native quiver graphics object
Edit this page on GitHub