Examples
Display grouped distributions.
violinplot([1 1 1 2 2 2], [1 2 2 3 4 5]);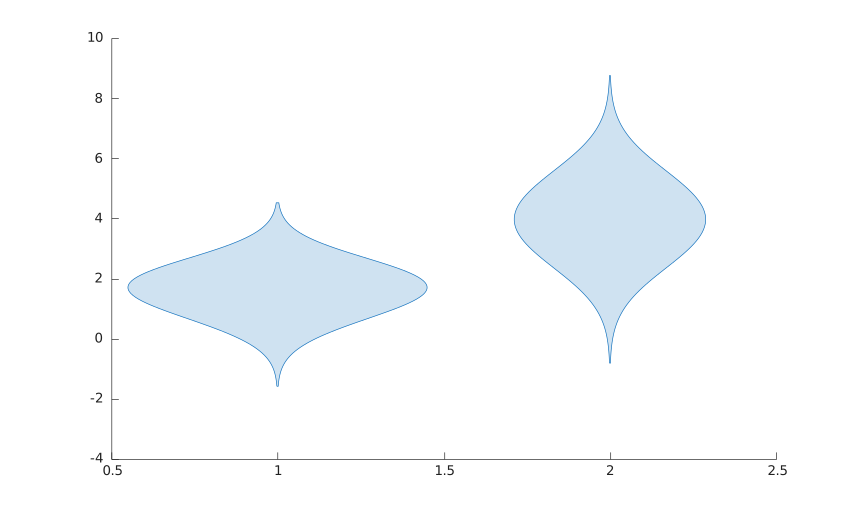
violinplot(y)
violinplot(xgroupdata, y)
violinplot('EvaluationPoints', evalPoints, 'DensityValues', densityValues)
violinplot(..., propertyName, propertyValue)
h = violinplot(...)
violinplot displays distributions as violin shapes and returns one or more violinplot graphics objects.
For vector data, the returned object keeps XData as group positions and YData as the original values. For matrix data, one object is returned for each column.
With EvaluationPoints and DensityValues and no sample data, violinplot draws precomputed densities: one violin per column, at positions 1, 2, ... Both arguments are then required, and they cannot be combined with sample data.
Each violin outlines a Gaussian kernel density estimate of its values, evaluated on 100 points from min(y) - 3h to max(y) + 3h. The bandwidth follows the normal reference rule with a robust scale: h = (MAD / 0.6745) * (4 / (3 n))^(1/5), where MAD is the median absolute deviation. When the MAD is zero the data range is used as the scale, and constant data use h = 1.
The violinplot properties page lists the supported object properties.
violinplot([1 1 1 2 2 2], [1 2 2 3 4 5]);