Examples
Single box chart.
f = figure();
boxchart([1 2 3 4 12], 'BoxFaceColor', [0.2 0.5 0.8]);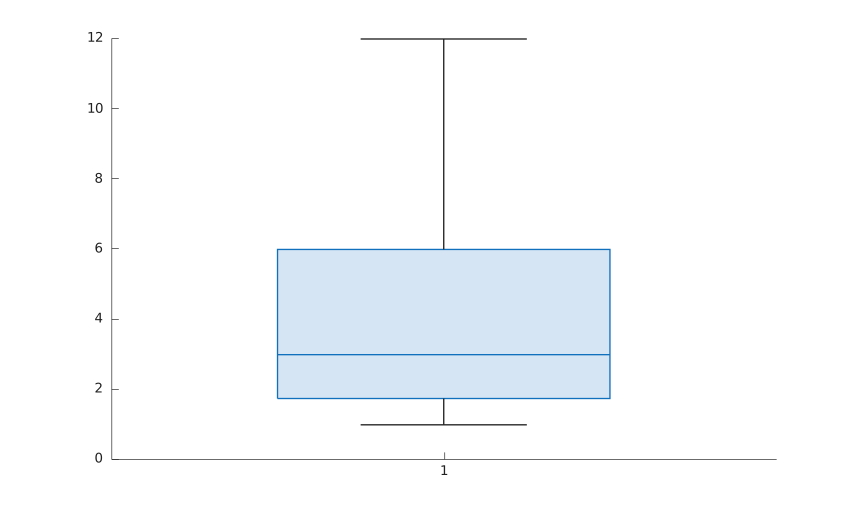
Grouped box chart.
f = figure();
g = categorical({'A', 'A', 'A', 'B', 'B', 'B'});
y = [1 2 8 4 5 15];
boxchart(g, y, 'MarkerStyle', 'x');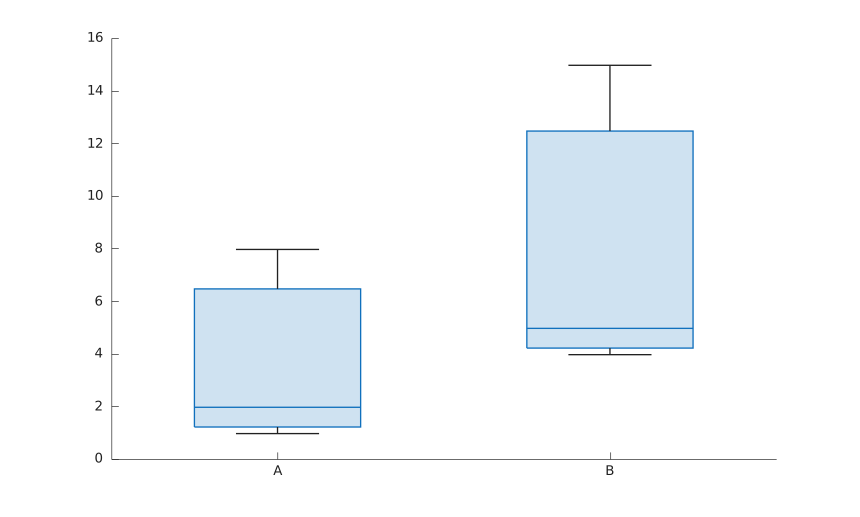
Color groups.
f = figure();
x = [1 1 2 2 2 1];
y = [10 20 3 4 100 15];
c = categorical({'red', 'blue', 'red', 'blue', 'red', 'blue'});
boxchart(x, y, 'GroupByColor', c);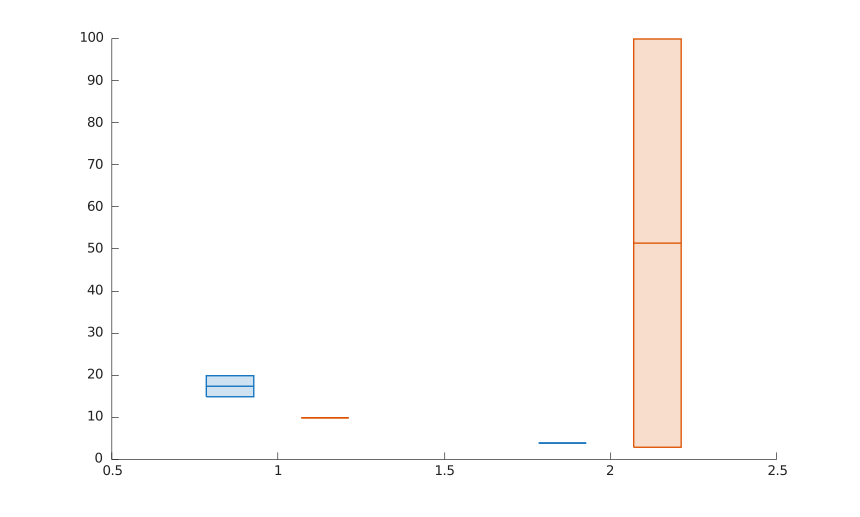
Box charts for the columns of a matrix.
f = figure();
Y = magic(10);
boxchart(Y);
xlabel('Column');
ylabel('Value');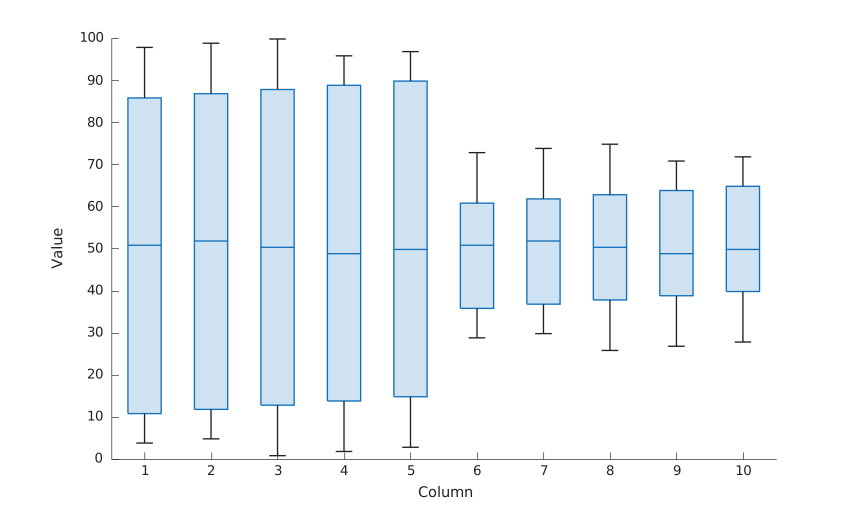
Notches and jittered outliers.
f = figure();
x = [ones(1, 8), 2 * ones(1, 8), 3 * ones(1, 8)];
y = [1 2 3 4 5 6 7 30, 4 5 6 7 8 9 10 11, 2 3 4 5 20 21 22 23];
boxchart(x, y, 'Notch', 'on', 'JitterOutliers', 'on');
xlabel('Group');
ylabel('Value');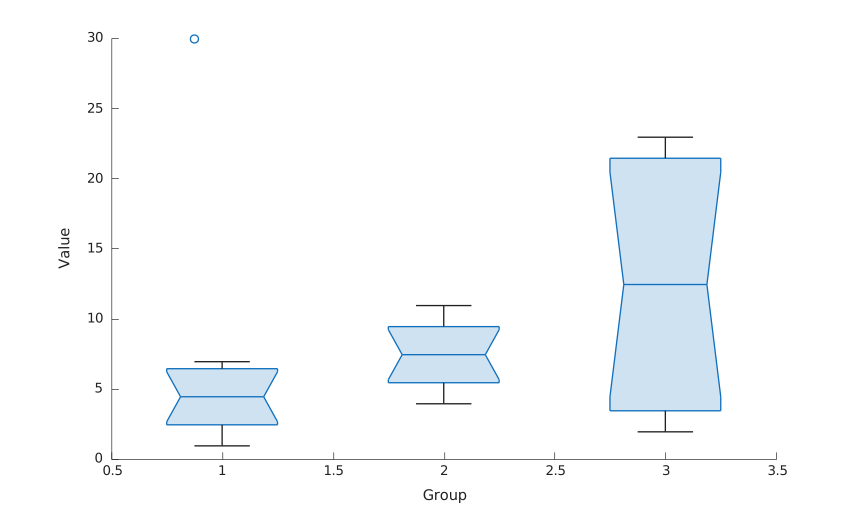
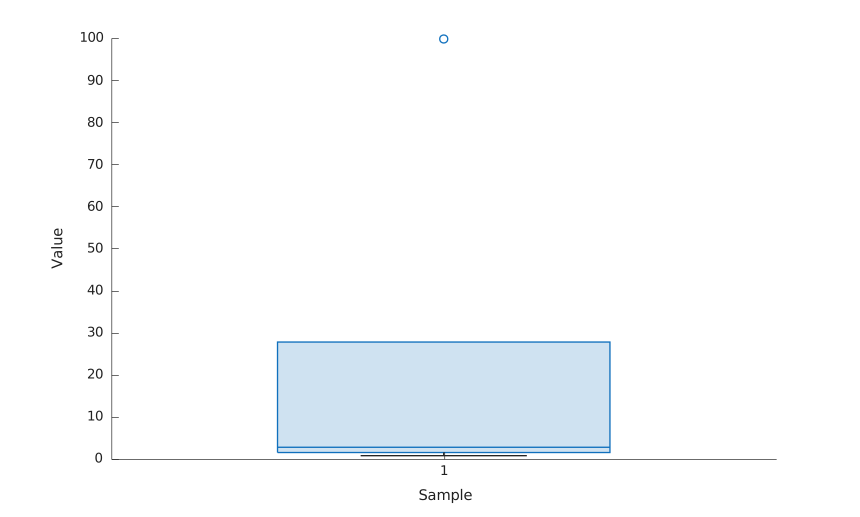
Outlier marker and box hinges.
f = figure();
boxchart([1 2 3 4 100]);
xlabel('Sample');
ylabel('Value');