Examples
Display grouped observations.
swarmchart([1 1 1 2 2 2], [4 5 3 7 6 8], 'filled');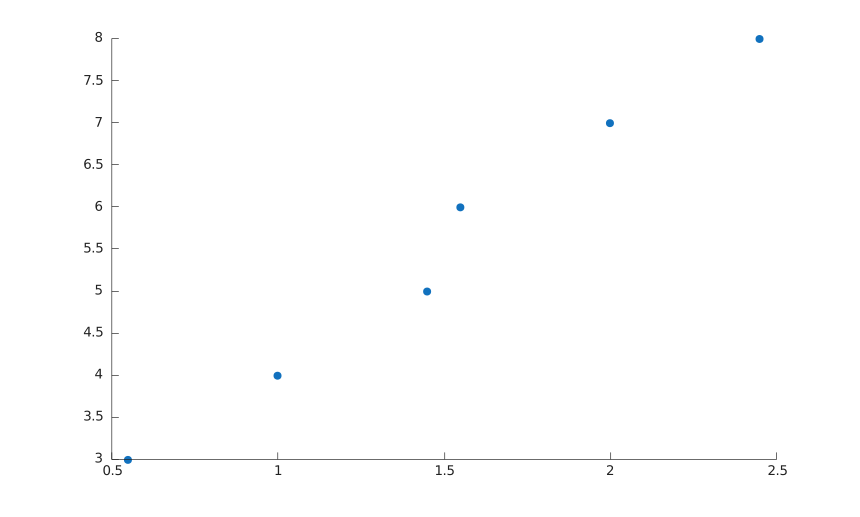
swarmchart(x, y)
swarmchart(x, y, sz, c)
swarmchart(..., propertyName, propertyValue)
h = swarmchart(...)
swarmchart displays points using a scatter object. The returned object keeps the original XData and YData and uses scatter jitter properties for the displayed x positions.
Supported chart properties are XJitter, XJitterWidth, and ColorVariable. Other arguments are forwarded to scatter.
swarmchart([1 1 1 2 2 2], [4 5 3 7 6 8], 'filled');