parallelplot
Display parallel coordinates plot.
📝Syntax
parallelplot(X)
parallelplot(T)
parallelplot(T, 'CoordinateVariables', variables)
parallelplot(..., 'GroupData', group)
parallelplot(..., 'GroupVariable', groupVariable)
parallelplot(..., 'CoordinateTickLabels', labels)
h = parallelplot(...)
📄Description

parallelplot displays rows of a numeric matrix or numeric table variables as parallel coordinate lines.

The returned object has type parallelplot. See parallelplot properties for the complete property list.

💡Examples
Plot matrix rows as parallel coordinates.
X = [1 10 100; 2 20 50; 3 30 0; 4 15 70];
parallelplot(X, 'CoordinateTickLabels', {'A', 'B', 'C'});
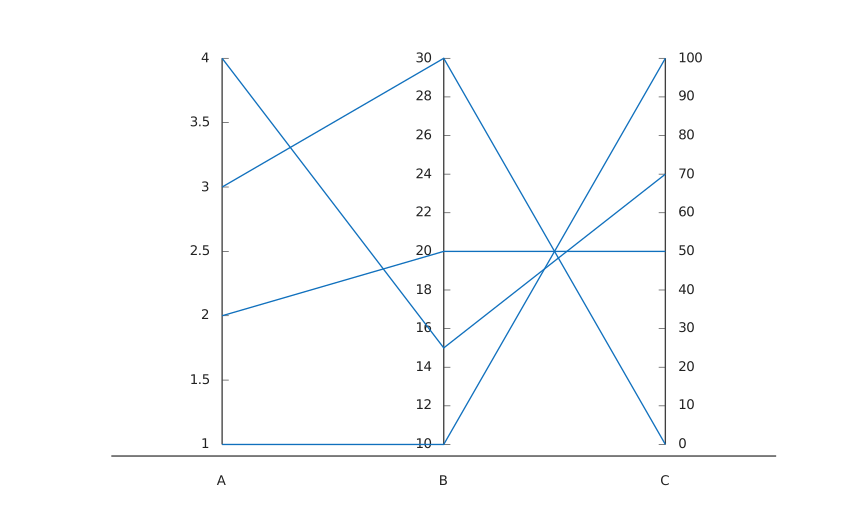
Example illustration
Plot selected table variables and group rows by a table variable.
T = table([1; 2; 3], [4; 5; 6], {'a'; 'a'; 'b'}, 'VariableNames', {'A', 'B', 'G'});
parallelplot(T, 'CoordinateVariables', {'A', 'B'}, 'GroupVariable', 'G');
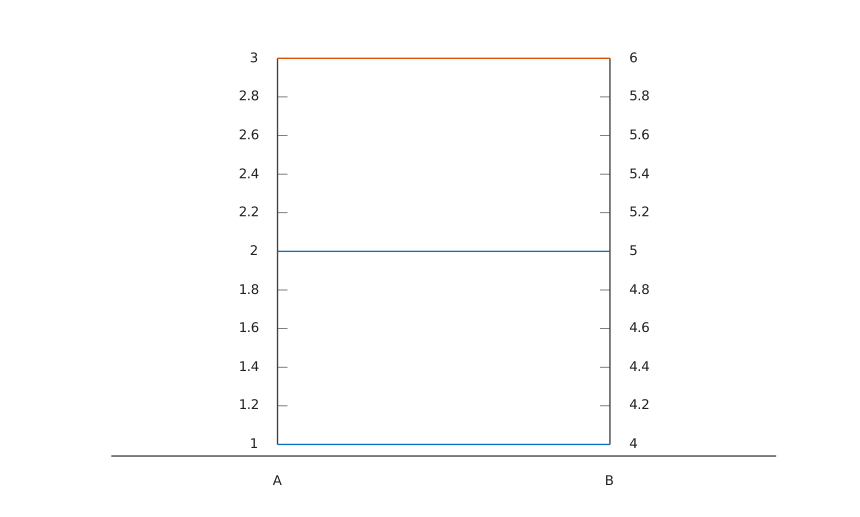
Example illustration
🔗See Also
plotmatrixstackedplotparallelplot propertiestable
Edit this page on GitHub