Examples
f = figure();
for i = 1:4
subplot(2, 2, i)
hist(randn(1000, 1), 50)
end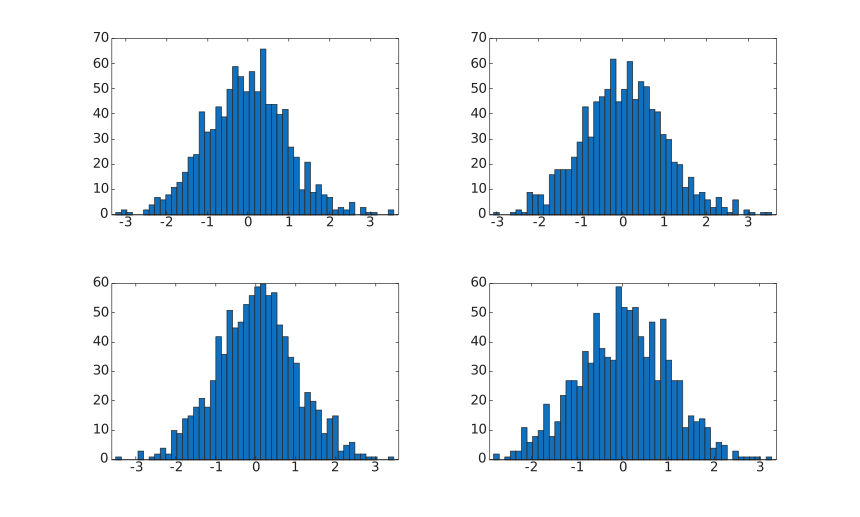
hist(x)
hist(x, nbins)
hist(ax, ...)
counts = hist(...)
[counts, centers] = hist(...)
| Parameter | Description |
|---|---|
| x | vector or matrix |
| nbins | vector. |
| ax | Axes object. |
| Parameter | Description |
|---|---|
| counts | Counts of the number of elements in each bin: row vector for a vector input, one column of counts per column of a matrix input. |
| centers | Bin centers: vector. |
A histogram is a graphical representation that illustrates the distribution of data values.
When you use the hist function, it organizes the elements in the vectorY into 10 equally spaced containers and provides the count of elements in each container as a row vector.
hist(Y, x) with a vectorx, the function will return the distribution of values inY among bins determined by the length of x, with centers specified by the values in x.
For instance, if x is a 5-element vector,hist will categorize the elements of Y into five bins, each centered on the x-axis at the values specified inx.
A matrix Y is a set of samples, one per column: hist counts each column on its own and returns one column of counts per column of Y, and draws one bar series per column. The bins are read on the whole matrix, so every column is counted against the same bins.
When you use hist(...) without specifying any output arguments, it generates a histogram plot. The bins are distributed along the x-axis between the minimum and maximum values found in the input vectorY.
The statistics module carries a hist of its own, which this one takes over from as soon as the graphics module is loaded. Both count their bins the same way, so the same call answers the same counts either way; the one here is the only one that draws and the only one that accepts a designated axes.
f = figure();
for i = 1:4
  subplot(2, 2, i)
  hist(randn(1000, 1), 50)
end| Version | Description |
|---|---|
| 1.0.0 | initial version |