Examples
Box plots for matrix columns.
X = [1 2 3; 2 4 6; 3 6 9; 8 7 12];
boxplot(X, 'Labels', {'A', 'B', 'C'});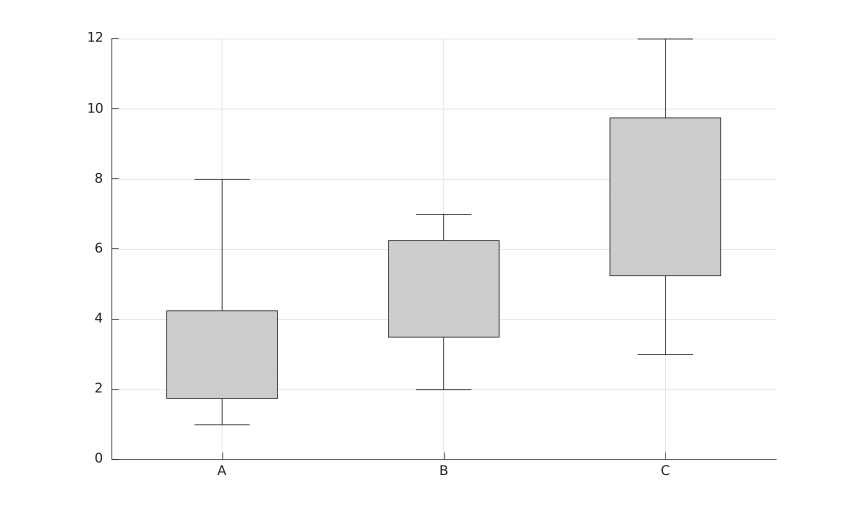
Grouped heights with text labels.
girls = randn(10, 1) * 5 + 140;
boys = randn(13, 1) * 8 + 135;
heights = [girls; boys];
sex = [ones(numel(girls), 1); 2 * ones(numel(boys), 1)];
boxplot(heights, sex, 'Labels', {'girls', 'boys'});
xlim([0 3]);
title('Grade 3 heights');
Group splitting with explicit positions.
data = [(randn(10, 1) * 5 + 140); (randn(25, 1) * 8 + 135); ...
  (randn(20, 1) * 6 + 165)];
groups = [ones(10, 1); ones(25, 1) * 2; ones(20, 1) * 3];
labels = {'Team A', 'Team B', 'Team C'};
pos = [2, 1, 3];
boxplot(data, groups, 'Notch', 'on', 'Labels', labels, 'Positions', pos, ...
  'BoxStyle', 'filled', 'Widths', 0.45);
title('Group splitting with paired vectors');
Colors specified with characters.
boxplot(randn(100, 9), 'Notch', 'on', 'BoxStyle', 'filled', ...
  'Colors', 'ygcwkmb', 'Whisker', 1.2);
title('Different colors specified with characters');
Colors specified as RGB values.
colors = [0.7 0.7 0.7; 0.0 0.4 0.9; 0.7 0.4 0.3; ...
  0.7 0.1 0.7; 0.8 0.7 0.4; 0.1 0.8 0.5; 0.9 0.9 0.2];
boxplot(randn(100, 13), 'Notch', 'on', 'BoxStyle', 'filled', ...
  'Colors', colors, 'Whisker', 1.3, 'Widths', 0.45);
title('Different colors specified as RGB values');
Grouped horizontal box plots.
y = [1 2 3 4 10 11 12 25];
g = {'left', 'left', 'left', 'left', 'right', 'right', 'right', 'right'};
boxplot(y, g, 'Orientation', 'horizontal', 'Symbol', 'rx');