Examples
Plot a helix.
fplot3(@(t) cos(t), @(t) sin(t), @(t) t, [0 6*pi]);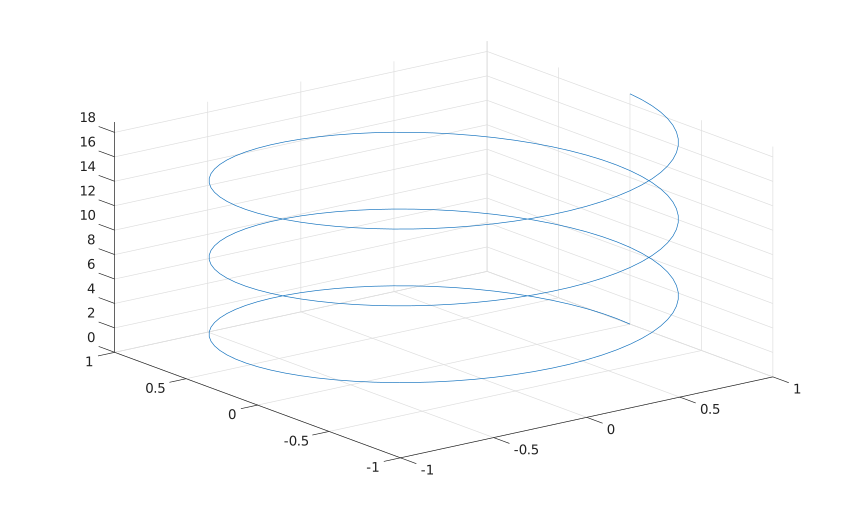
Customize line style.
fplot3(@(t) t, @(t) t.^2, @(t) t.^3, [-2 2], 'r--', 'LineWidth', 2);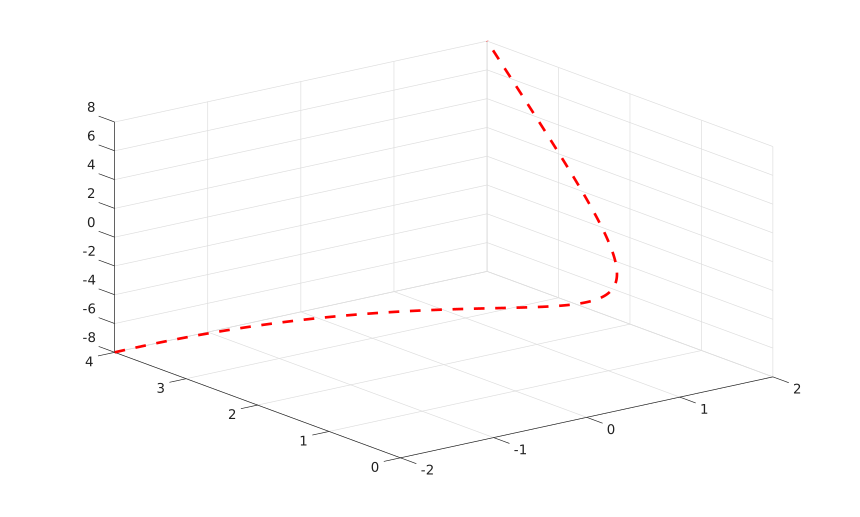
fplot3(xfun, yfun, zfun)
fplot3(xfun, yfun, zfun, tinterval)
fplot3(..., LineSpec)
fplot3(parent, ...)
h = fplot3(...)
| Parameter | Description |
|---|---|
| xfun, yfun, zfun | Function handles evaluated on the parameter interval. |
| tinterval | Two-element increasing finite vector. The default is [-5 5]. |
| LineSpec | Line style, marker, and color specification. |
| Name-Value pairs | Line properties and parameterizedfunctionline properties, including MeshDensity. |
| Parameter | Description |
|---|---|
| h | Parameterized function line graphics object. |
fplot3 samples three function handles over a parameter interval and displays the resulting 3-D curve.
fplot3(@(t) cos(t), @(t) sin(t), @(t) t, [0 6*pi]);fplot3(@(t) t, @(t) t.^2, @(t) t.^3, [-2 2], 'r--', 'LineWidth', 2);