errorbar
Plot data with error bars.
📝Syntax
errorbar(Y, E)
errorbar(X, Y, E)
errorbar(X, Y, YNEG, YPOS)
errorbar(..., orientation)
errorbar(X, Y, YNEG, YPOS, XNEG, XPOS)
errorbar(..., lineSpec)
errorbar(..., propertyName, propertyValue)
errorbar(ax, ...)
h = errorbar(...)
📥Input Arguments
Parameter Description
X x data values.
Y y data values.
E symmetric y error values.
YNEG negative y error values.
YPOS positive y error values.
XNEG negative x error values.
XPOS positive x error values.
orientation error bar orientation: 'vertical', 'horizontal', or 'both'.
lineSpec line style, marker, and color specification.
propertyName errorbar object property name.
propertyValue errorbar object property value.
ax target axes object.
📤Output Arguments
Parameter Description
h errorbar graphics object or row vector of errorbar objects for matrix data.
📄Description

errorbar plots x and y data with vertical or combined x/y error bars.

Vector inputs create one errorbar object. Matrix inputs create one errorbar object for each column.

See errorbar properties for the complete property list.

💡Examples
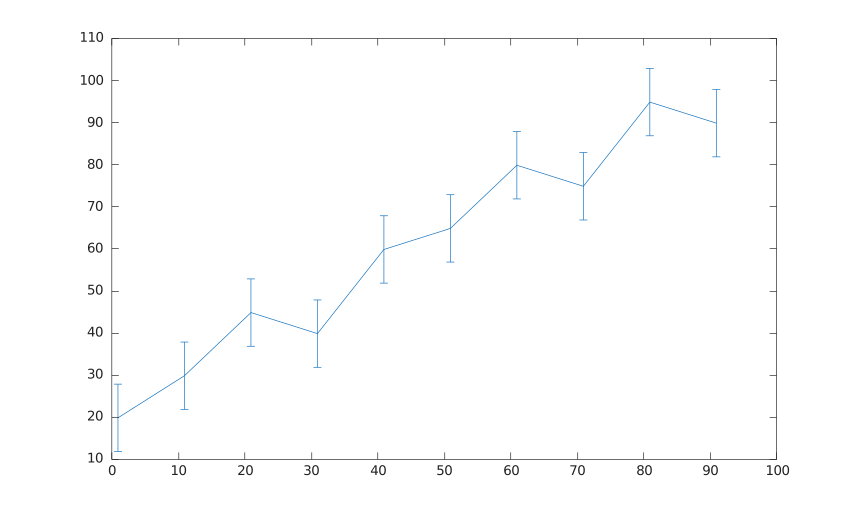
Plot vertical error bars of equal length.
x = 1:10:100;
y = [20 30 45 40 60 65 80 75 95 90];
err = 8 * ones(size(y));
errorbar(x, y, err);
Example illustration
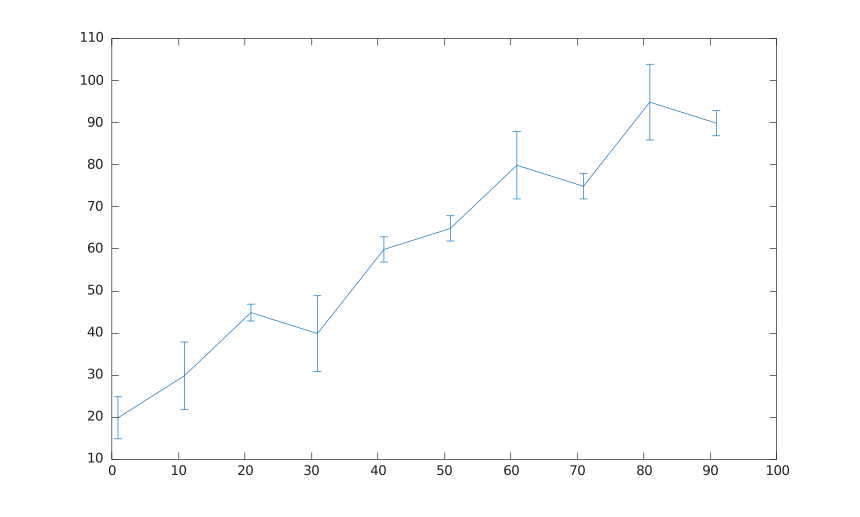
Plot vertical error bars that vary in length.
x = 1:10:100;
y = [20 30 45 40 60 65 80 75 95 90];
err = [5 8 2 9 3 3 8 3 9 3];
errorbar(x, y, err);
Example illustration
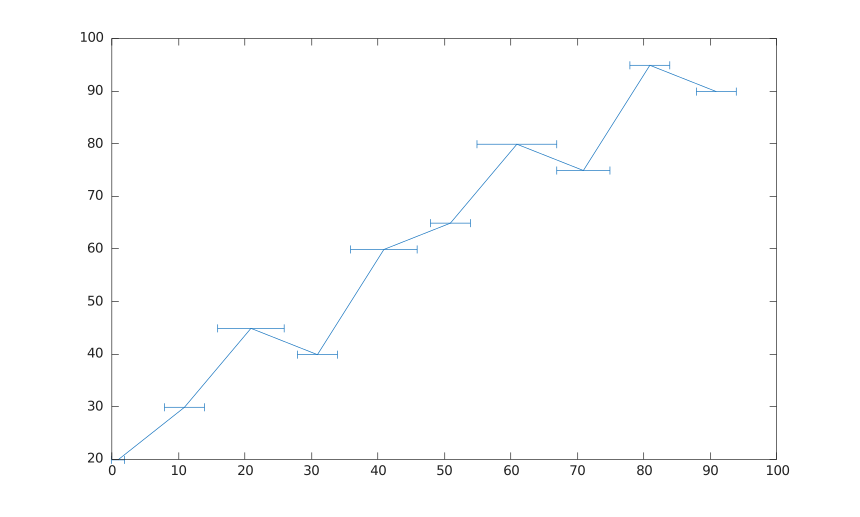
Plot horizontal error bars.
x = 1:10:100;
y = [20 30 45 40 60 65 80 75 95 90];
err = [1 3 5 3 5 3 6 4 3 3];
errorbar(x, y, err, 'horizontal');
Example illustration
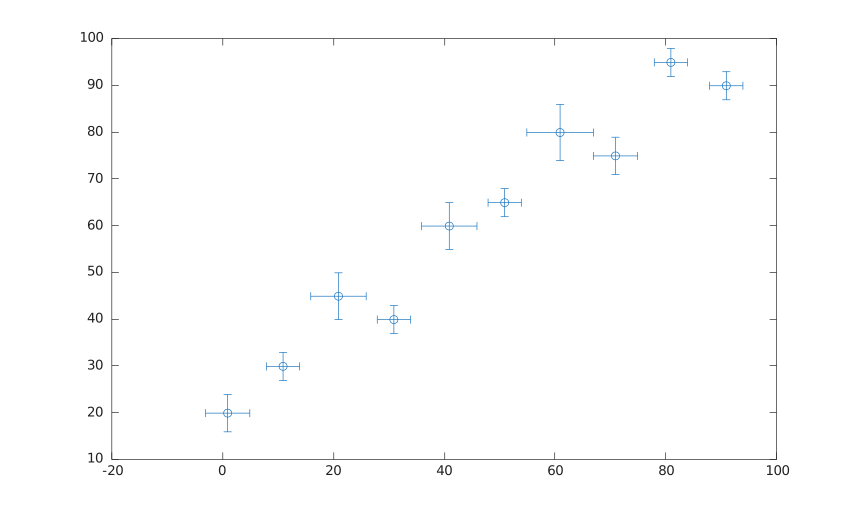
Plot vertical and horizontal error bars with markers only.
x = 1:10:100;
y = [20 30 45 40 60 65 80 75 95 90];
err = [4 3 5 3 5 3 6 4 3 3];
errorbar(x, y, err, 'both', 'o');
Example illustration
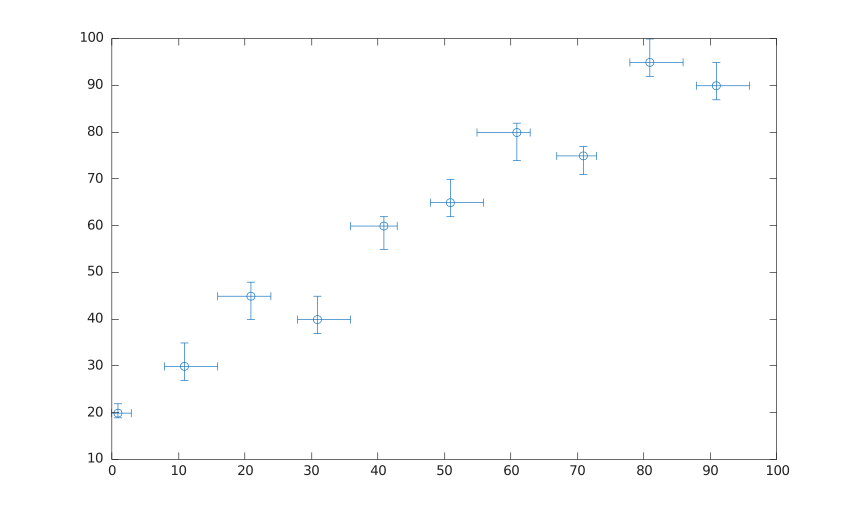
Control error bar lengths in all directions.
x = 1:10:100;
y = [20 30 45 40 60 65 80 75 95 90];
yneg = [1 3 5 3 5 3 6 4 3 3];
ypos = [2 5 3 5 2 5 2 2 5 5];
xneg = [1 3 5 3 5 3 6 4 3 3];
xpos = [2 5 3 5 2 5 2 2 5 5];
errorbar(x, y, yneg, ypos, xneg, xpos, 'o');
Example illustration
🔗See Also
errorbar propertiesplotline
Edit this page on GitHub