T = adaptthresh(I)
T = adaptthresh(I, sensitivity)
T = adaptthresh(__, 'ForegroundPolarity', polarity)
T = adaptthresh(__, 'NeighborhoodSize', size)
T = adaptthresh(__, 'Statistic', statistic)
| Paramètre | Description |
|---|---|
| I | Image d'entree. |
| sensitivity | Valeur scalaire de sensibilite. La valeur par defaut est 0.5. |
| 'ForegroundPolarity' | Polarite du premier plan, 'bright' ou 'dark'. |
| 'NeighborhoodSize' | Taille de voisinage a deux elements utilisee pour les statistiques locales. |
| 'Statistic' | Statistique locale : 'mean', 'gaussian' ou 'median'. |
| Paramètre | Description |
|---|---|
| T | Image de seuil adaptatif avec des valeurs dans l'intervalle [0, 1]. |
Calcule une image de seuil local pour binarisation adaptative. Les polarites de premier plan prises en charge sont bright et dark. Les statistiques prises en charge sont mean, gaussian et median.
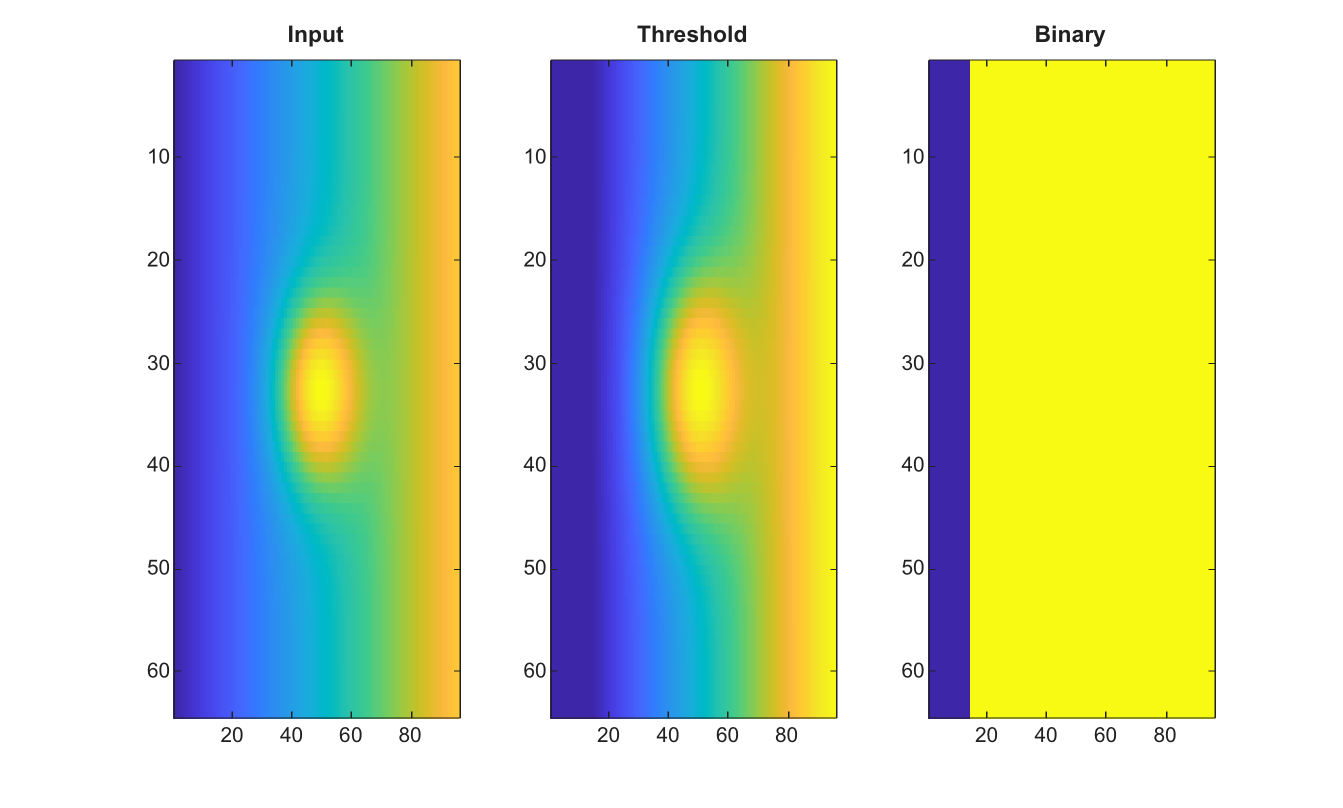
[X,Y]=meshgrid(linspace(-1,1,96),linspace(-1,1,64));
I=0.25+0.35*X+0.45*exp(-12*(X.^2+Y.^2));
T=adaptthresh(I,0.45,'NeighborhoodSize',[15 15]);
BW=I>T;
figure; subplot(1,3,1); imagesc(I); title('Input');
subplot(1,3,2); imagesc(T); title('Threshold');
subplot(1,3,3); imagesc(BW); title('Binary');
| Version | Description |
|---|---|
| 2.0.0 | version initiale |