fimplicit(fun)
fimplicit({fun1, fun2, ...})
fimplicit(fun, interval)
fimplicit(fun, [xmin xmax ymin ymax])
fimplicit(..., LineSpec)
fimplicit(..., nomPropriete, valeurPropriete)
fimplicit(parent, ...)
h = fimplicit(...)
fimplicit echantillonne fun(x,y) et trace le contour de niveau zero comme objet graphique implicitfunctionline.
Quand un tableau de cellules de fonctions est fourni, un objet implicitfunctionline est cree pour chaque fonction et le tableau de handles retourne est un vecteur colonne.
Voir proprietes de implicitfunctionline pour la liste complete des proprietes.
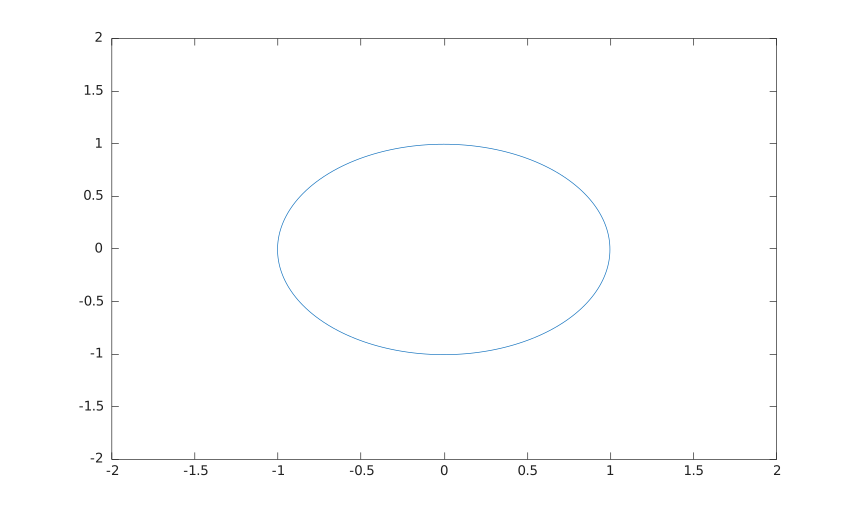
fimplicit(@(x, y) x.^2 + y.^2 - 1, [-2 2 -2 2]);
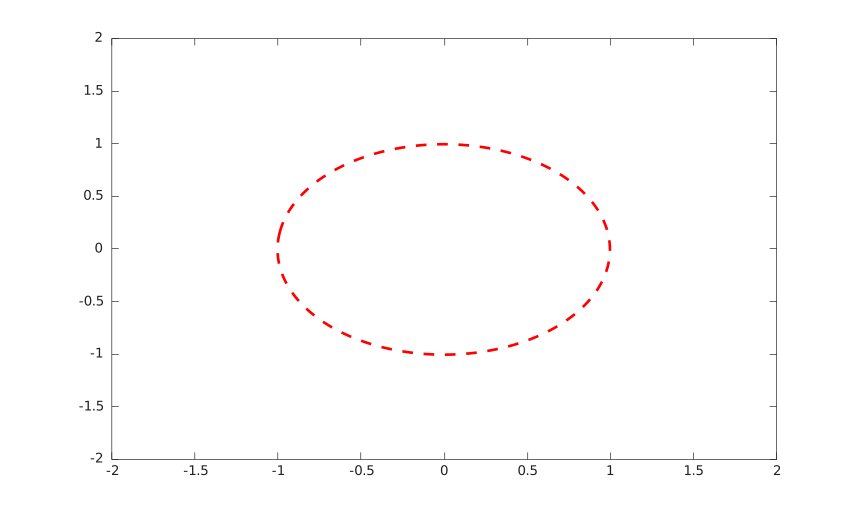
h = fimplicit(@(x, y) x.^2 + y.^2 - 1, [-2 2], '--r', 'LineWidth', 2);
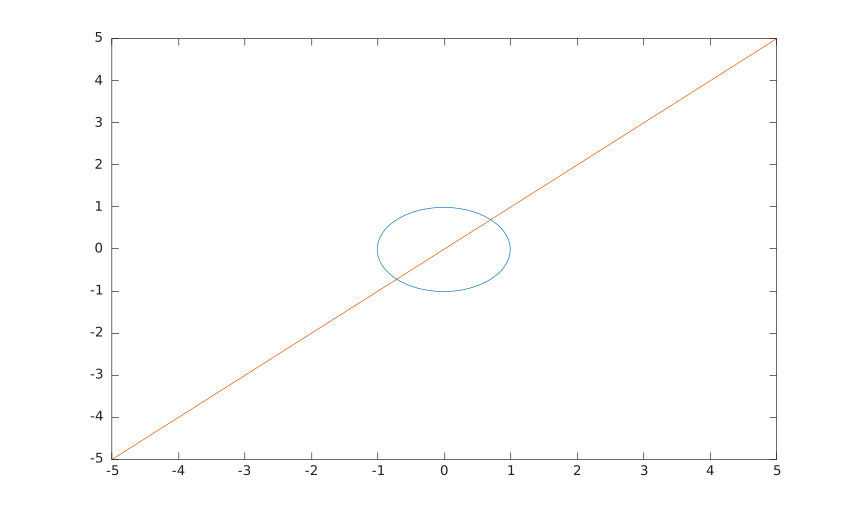
f1 = @(x, y) x.^2 + y.^2 - 1;
f2 = @(x, y) x - y;
h = fimplicit({f1, f2});