Exemples
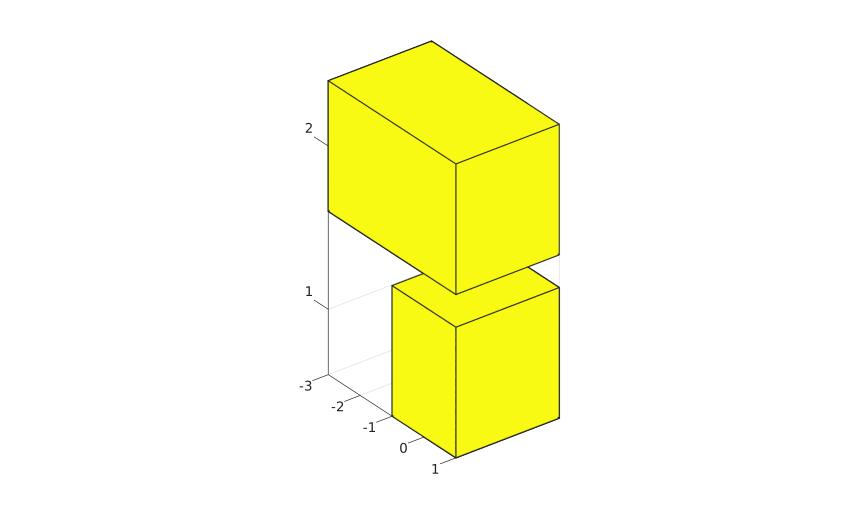
Barres horizontales 3-D detachees depuis une matrice.
f = figure();
Y = [1 3; 2 4; 5 2];
bar3h(Y);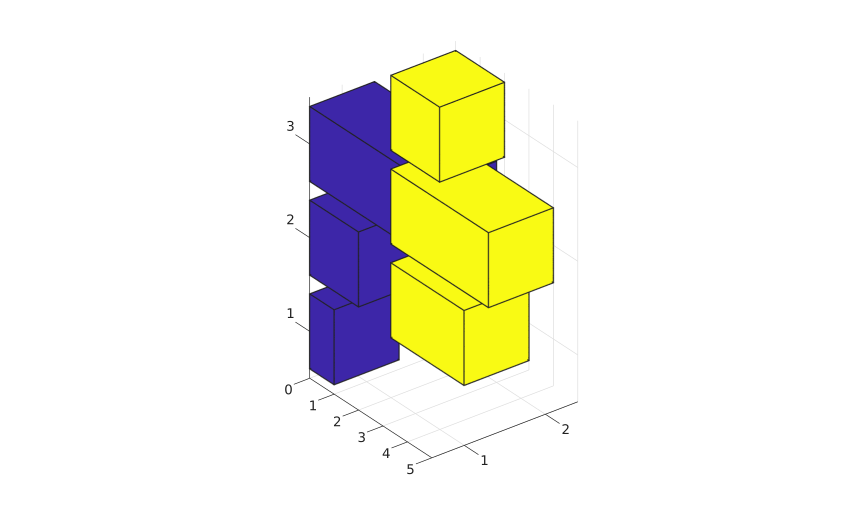
Barres horizontales 3-D depuis un vecteur.
f = figure();
y = [50 40 30 20 10];
bar3h(y);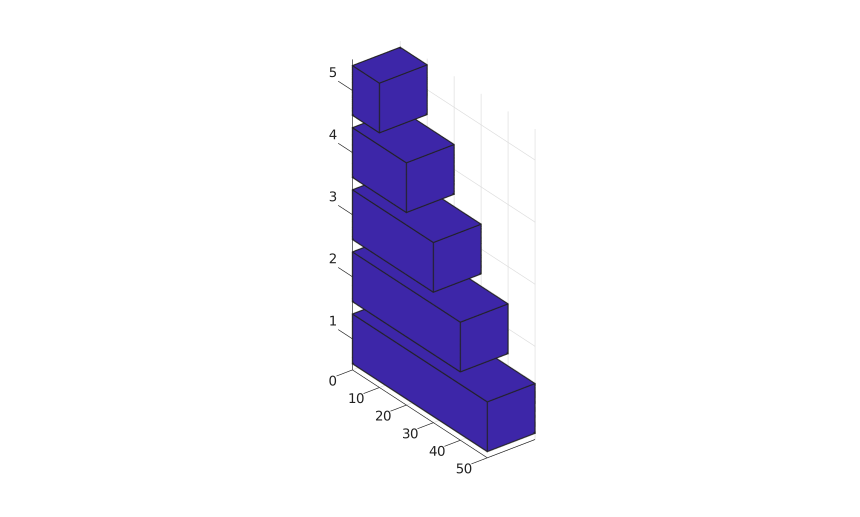
Barres horizontales 3-D avec positions explicites.
f = figure();
z = [1950 1960 1970 1980 1990];
y = [16 8 4 2 1];
bar3h(z, y);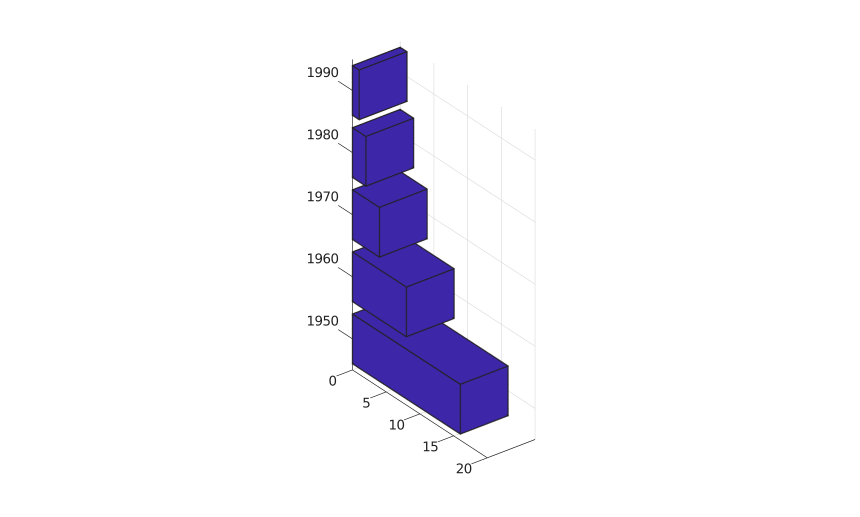
Barres horizontales 3-D depuis une matrice.
f = figure();
y = [1 4 7; 2 5 8; 3 6 9; 4 7 10];
bar3h(y);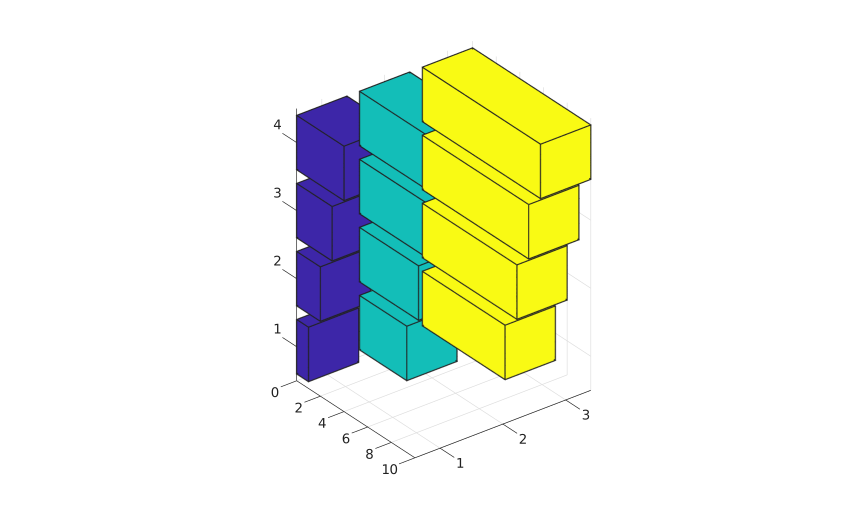
Barres horizontales 3-D depuis une matrice avec positions explicites.
f = figure();
z = [1 2 3 4];
y = [1 5 9; 2 6 10; 3 7 11; 4 8 12];
bar3h(z, y);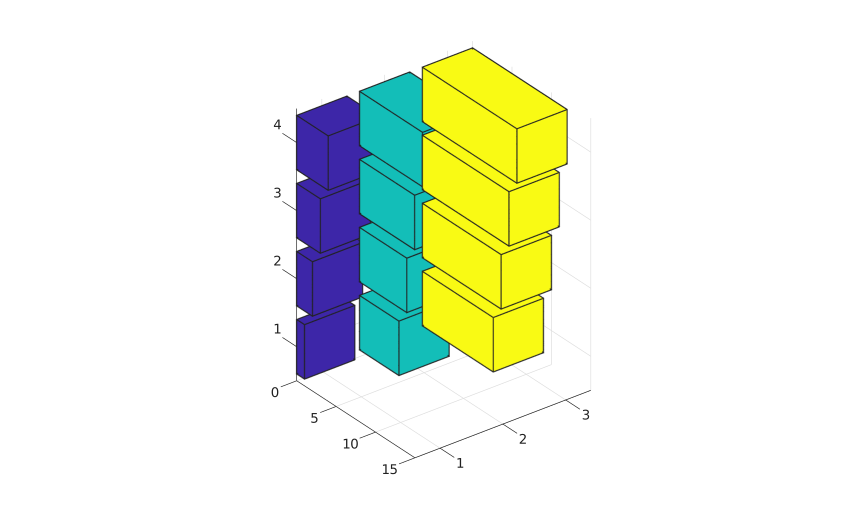
Barres horizontales 3-D avec largeur et couleur.
f = figure();
z = 0:pi/16:pi;
y = [sin(z') / 4, sin(z') / 2, sin(z')];
bar3h(z, y, 1, "r");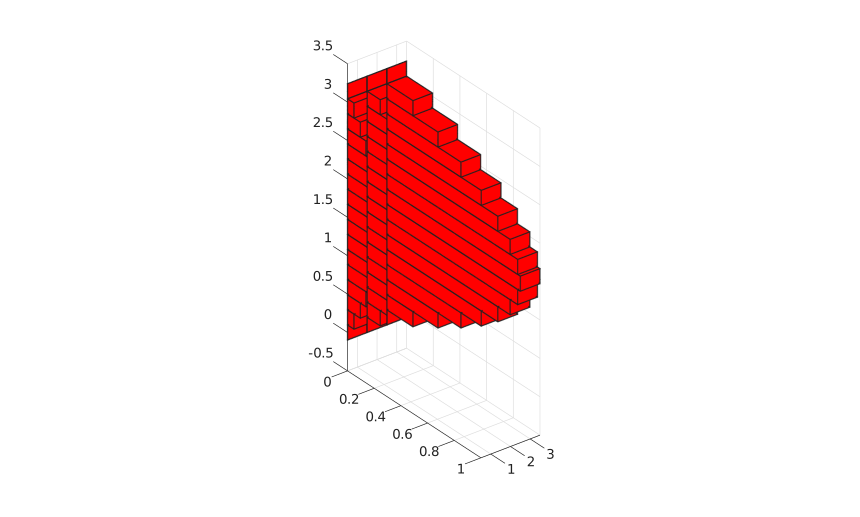
Barres horizontales 3-D groupees.
f = figure();
y = [1 2; 3 4; 5 6];
bar3h(y, 'grouped');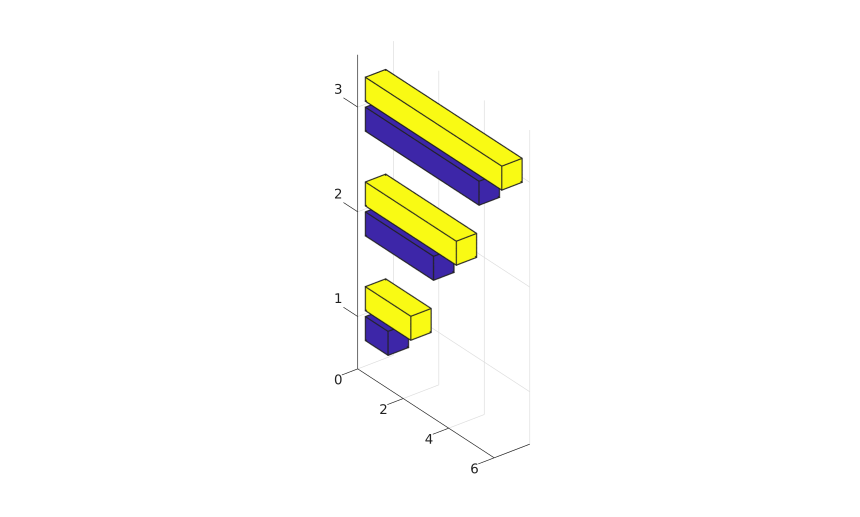
Barres horizontales 3-D empilees avec valeurs positives et negatives.
f = figure();
y = [1 -2; -3 4];
bar3h(y, 'stacked');