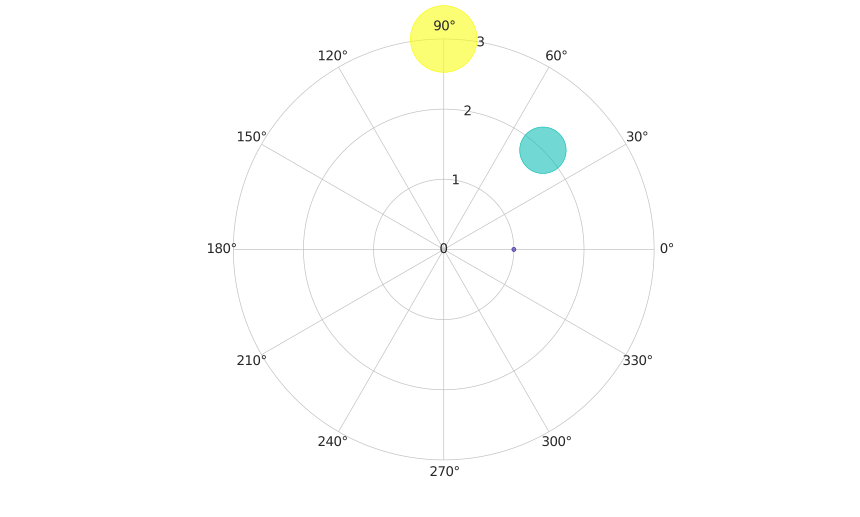
polarbubblechart(theta, rho, taille)
polarbubblechart(theta, rho, taille, couleur)
polarbubblechart(tbl, thetavar, rhovar, taillevar)
polarbubblechart(tbl, thetavar, rhovar, taillevar, couleurvar)
polarbubblechart(parent, ...)
h = polarbubblechart(...)
polarbubblechart affiche des marqueurs polaires dont la taille depend des donnees de bulles.
L'entree table selectionne les donnees d'angle, de rayon, de taille et de couleur optionnelle depuis les variables de tbl. Plusieurs variables selectionnees creent plusieurs objets bubblechart.
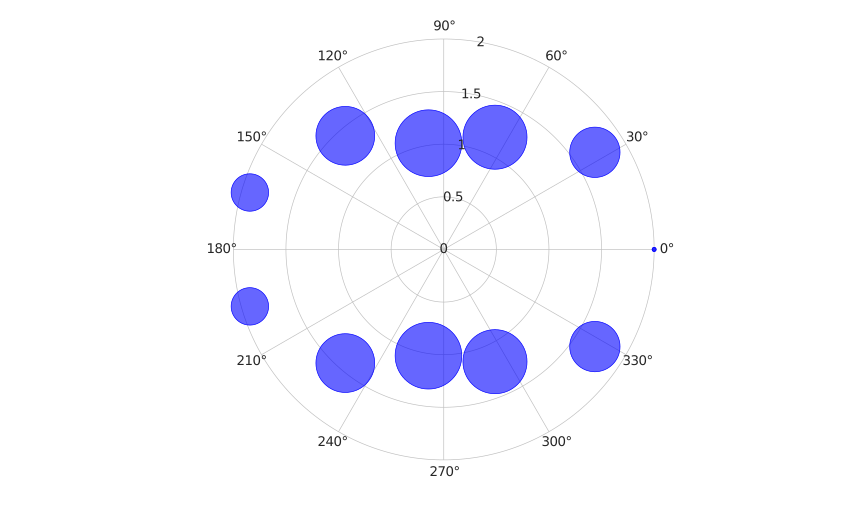
theta = linspace(0, 2*pi, 12);
rho = 1 + cos(theta).^2;
taille = 20 + 60 * abs(sin(theta));
polarbubblechart(theta, rho, taille, 'b');
t = table([0; pi/4; pi/2], [1; 2; 3], [25; 36; 49], [1; 2; 3], ...
'VariableNames', {'theta', 'rho', 'sz', 'c'});
h = polarbubblechart(t, 'theta', 'rho', 'sz', 'c');