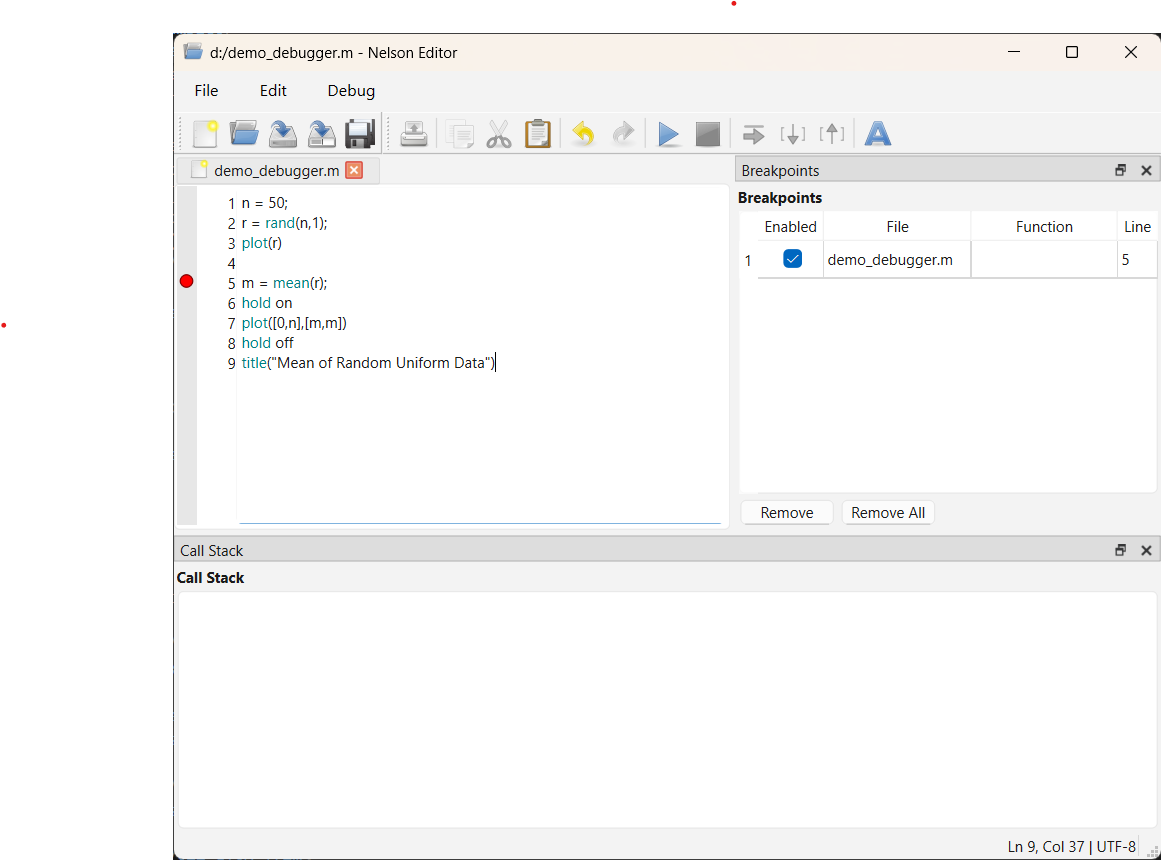
The Nelson debugger provides interactive tools to diagnose and fix
problems in scripts and functions by controlling execution and
inspecting program state. The Qt desktop and the web desktop expose
the same controls, keys, marker colours and menu labels.
Before starting a debugging session, save the code files. Breakpoints
belong to the saved file: while a file has unsaved changes its markers
turn dark gray (invalid) and are re-applied to their new lines when the
file is saved. Saving a file while execution is paused ends the
debugging session.
Breakpoints
Click in the left margin next to a line number, or press
F12 on the line, to set or clear a standard breakpoint (red).
A breakpoint requested on a comment, a blank line or a
function line moves to the next executable line; the
end of a loop or of a function is a stop line of its own.
Lines such as else, elseif, case,
otherwise and catch move to the next statement.
Right-click the margin to open the breakpoint menu:
Set/Clear Breakpoint, Set/Modify Condition... (orange
conditional breakpoint: execution pauses only when the expression is
true; an expression that fails or is not a scalar prints a warning and
pauses), Enable/Disable Breakpoint (light gray when disabled),
Enable/Disable All Breakpoints in File,
Clear All Breakpoints in File and Clear All Breakpoints.
The same operations are available from the command line with
dbstop, dbclear and dbstatus; the editor and the
Breakpoints panel follow them.
Pause on Errors (dbstop if error) pauses on an
uncaught error: the error is displayed, then the line; the workspace of
the failing function can be inspected and the session ends with
Continue, Step or Stop. Pause on Caught Errors
(dbstop if caught error) pauses before a
catch block runs; Continue resumes in it.
Running and stepping
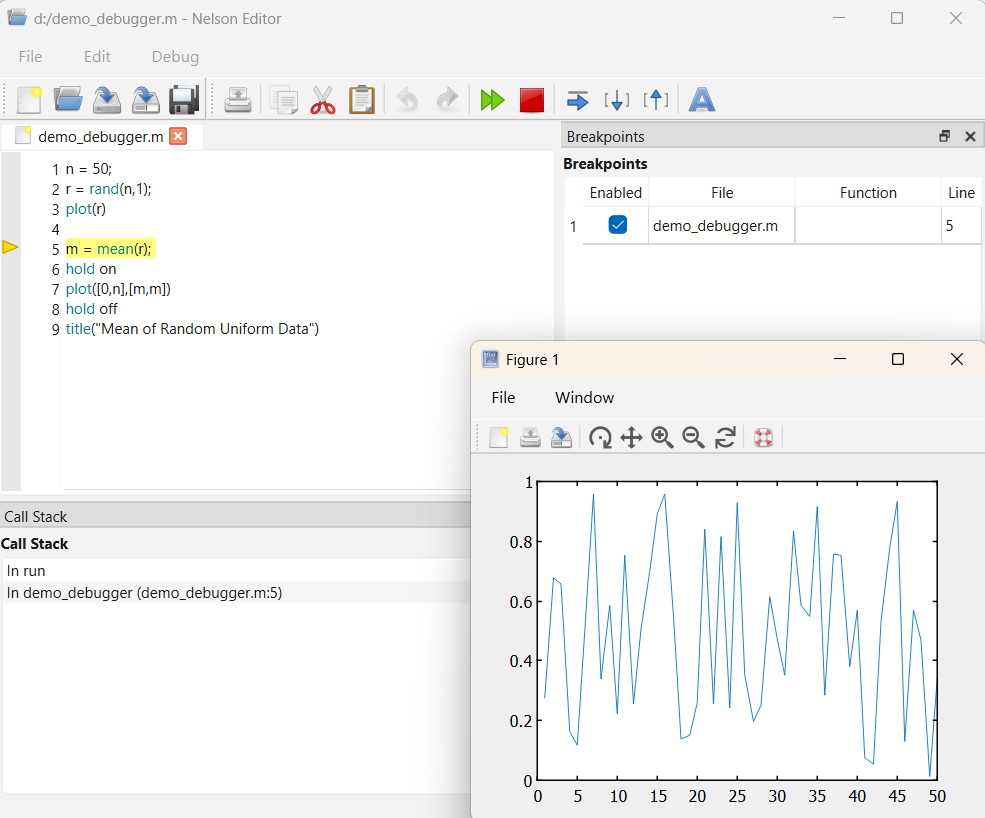
When execution pauses, the file opens in the editor, the current line is
highlighted in green with an arrow in the margin, and the command prompt
becomes K>>. The current line has not been executed yet.
A stop reached from a command typed in the console also prints the line
there, as 3 r = r * 2;; a stop reached from the editor (Step,
Continue, Run to Here, Run) moves the arrow without printing it. The printed
line number is a link: a click opens the editor at that line.
Keys: F5 Run, or Continue while paused;
F10 Step; F11 Step In; Shift+F11 Step Out;
Shift+F5 Stop (dbquit); F12 Set/Clear
Breakpoint; F9 Evaluate Selection; F6 Pause, which pauses
a running program at its next statement; Ctrl+F10 Run to Here,
which runs to the cursor line and pauses before it.
While paused, hovering a variable name shows its value (data tip); the
Breakpoints panel lists every breakpoint with its condition and enabled
state, and the Call Stack panel lists the active functions (click a
frame to open it). Each function has its own workspace: stepping into a
function switches the Workspace browser to it.
Breakpoints last until they are cleared or Nelson exits; they are not
saved between sessions.