Examples
[pxx, f] = pwelch(rand(256, 1), hamming(64), 32, 128, 1, 'centered');Plot Welch's power spectral density estimate.
pwelch(sin((0:255)' * 0.1) + 0.5 * sin((0:255)' * 0.4), hamming(64), 32, 128, 1, 'centered');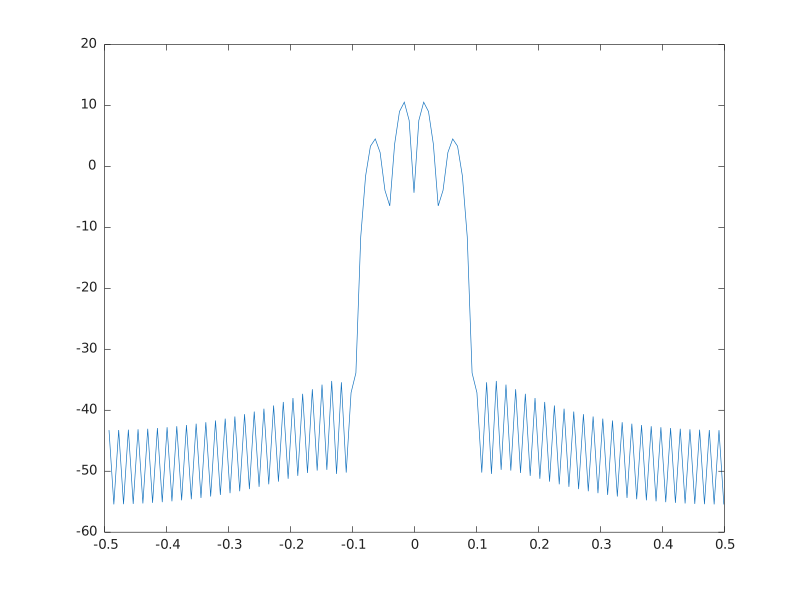
[Pxx, F] = pwelch(X)
[Pxx, F] = pwelch(X, window, noverlap, NFFT, Fs)
[Pxx, F] = pwelch(..., FREQRANGE)
[Pxx, F] = pwelch(..., SPECTRUMTYPE)
| Parameter | Description |
|---|---|
| X | input signal. |
| window | window vector or length. |
| noverlap | number of overlapping samples. |
| NFFT | FFT length. |
| Fs | sample rate. |
| FREQRANGE |
'onesided', 'twosided', 'centered', 'half', or 'whole'. |
| SPECTRUMTYPE |
'psd' or 'power'. |
| Parameter | Description |
|---|---|
| Pxx | averaged spectral estimate. |
| F | frequency vector. |
pwelch estimates a spectrum by averaging periodograms of overlapped segments.
[pxx, f] = pwelch(rand(256, 1), hamming(64), 32, 128, 1, 'centered');pwelch(sin((0:255)' * 0.1) + 0.5 * sin((0:255)' * 0.4), hamming(64), 32, 128, 1, 'centered');| Version | Description |
|---|---|
| 2.0.0 | initial version |